Home
About
Indicators
Sea Surface
Temperature
Heat
Content
Volume
Transport
Sea Surface
Salinity
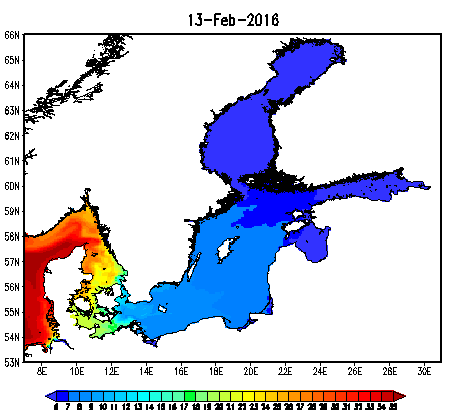
Sea Surface Salinity for BOOS region
Daily mean SSS (psu) forecast for 13-Feb-2016
Currently viewing SSS data. Please click on the SSS anomaly title link to view SSS anomaly data.
SSS
(1)
Mean
(3)
Min/Max
Monthly Tendency
(4)
11.5 psu
max: 35.2 psu
min: 0.0 psu
1.0 psu/month
SSS anomaly
(2)
Mean
Min/Max
Monthly Tendency
-0.1 psu
max: undef psu
min: undef psu
0.9 psu/month
To see an explanation of terms and keys, please click on one the references or indicator symbols
Evolution of basin mean SSS (psu)
Update : 12-Feb-2016