The beach water temperature predictions of
the DMI-BSHcmod ocean model have been compared to the measurements
of beach water temperatures made by TV2-vejret.
Observations are made from the end of June to the end of
August, and all temperatures are measured once a day at a
depth of one meter.
The DMI-BSHcmod ocean model divides the ocean into many small boxes
in a grid. The model temperature is taken from the gridpoint
closest to the point of observation. This point is up to 10
km away, though most points are closer. Click
here
for more information. A point within one hour of
the observation time is marked with a circle on the graphs and
used in the statistics.
Click on the station map or choose a station from the list
to view graphs of the observed and modelled temperatures,
or click here to see an overview
of the bias and standard deviation for all stations.
|
|
|
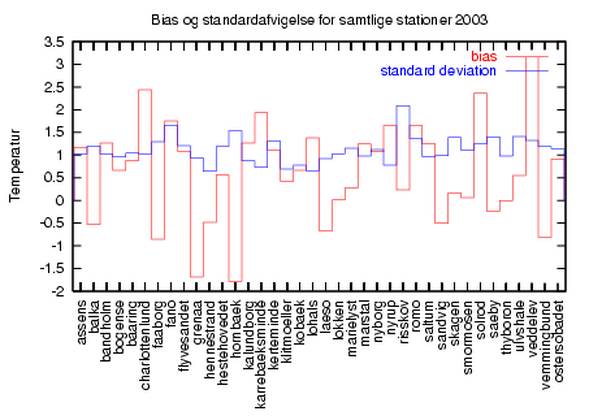
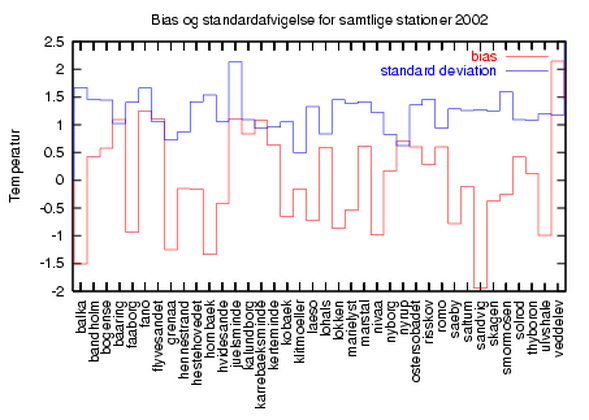
The bias and standard deviation (std) has been calculated for
each station for the summer seasons of 2002 and 2003. The mean values are:
|
Mean bias |
Mean std |
| 2003 |
0.62 |
1.11 |
| 2002 |
0.04 |
1.26 |
The values for each station are:
|
|
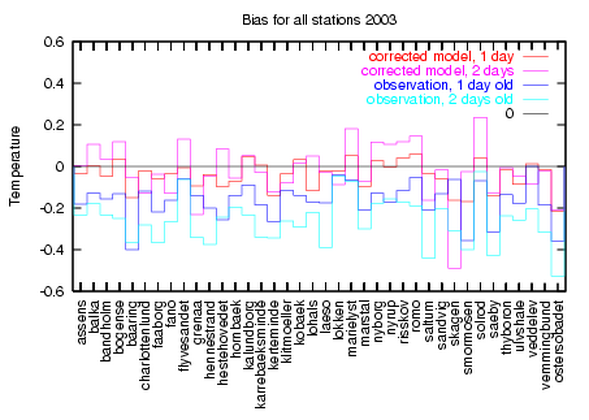
Corrections by comparison to observations
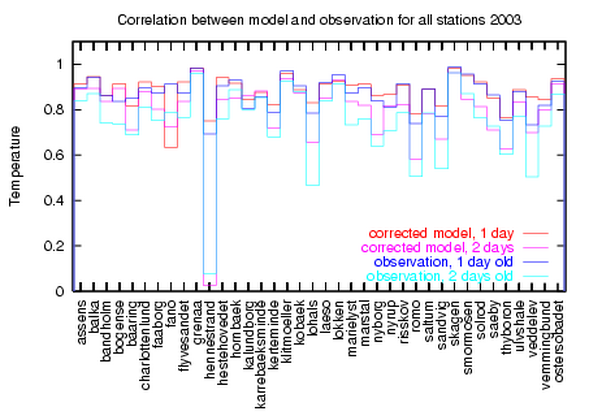
The above model data contains a bias. To minimize this, the model for the upcoming days can be corrected with the present day difference between model and observation. Click here to se a table of bias, standard deviation, covariance and correlation for the uncorrected and corrected models for 2003.
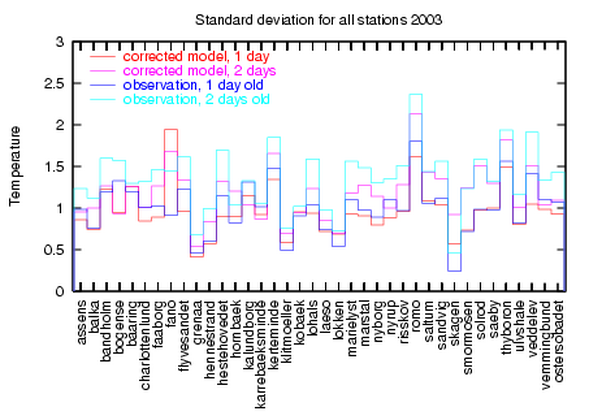
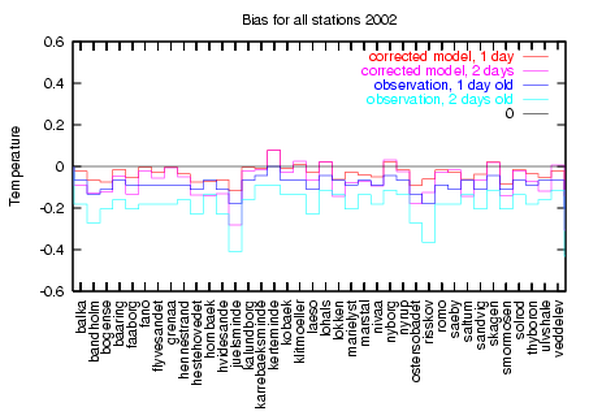
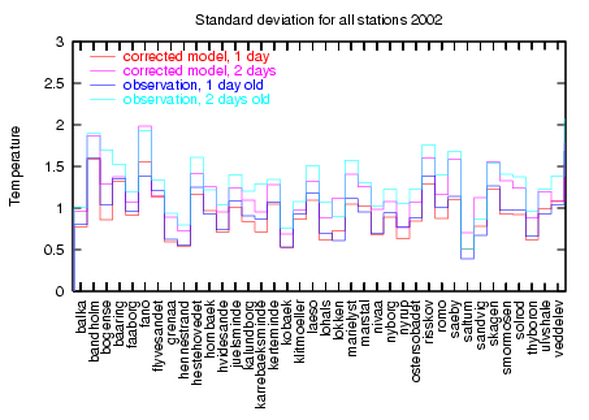
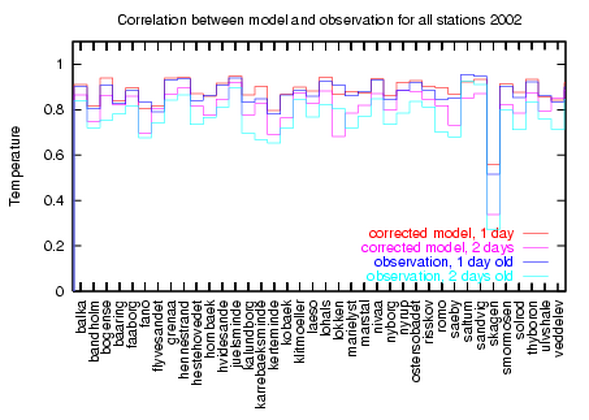
If our forecasts are to be used, they should be better than the simple assumption that the temperature in the upcoming days will be the same as the most resent observed temperature. The figures below show bias, standard deviation and correlation for the corrected model as described above and for the assumption that the temperatures are the same as observed one or two days ago. It is generally seen that the corrected model gives a smaller bias, and that the standard devialtion is higher and correlation is lower for the two days old observations.
2003
2002
|
|
Kristine Madsen - March 12th 2004
|
