Background
This is a storm surge model intercomparison study for the North Sea.
We compare one calendar year of observed and forecasted high waters,
using data provided by the
NOOS community, i.e. institutes
from countries bordering the North West European Shelf Seas.
The station table is collated from locations each participant considers
most important, and totals 23 stations.
Observations are collected in real time,
and quality controlled for spurious peaks.
Data gaps due to transmission problems are filled in using forecasts
of longer range, where possible.
All data are time interpolated to 10 min interval.
We examine only the forecast with the shortest range
available for each model. This depends on the analysis time step.
Validation of forecasts of longer range (1,2,.. days) remains to be worked out.
North Sea - Baltic Sea ocean models
| institute |
country |
analysis step |
hindcast |
forecast range |
forecast step |
observation step |
| bsh |
germany |
6 hours |
0 hours |
84 hours |
5 min |
15 min |
| dmi |
denmark |
6 hours |
0 hours |
120 hours |
10 min |
10 min |
| met.no (tidl. dnmi) |
norway |
12 hours |
18 hours |
60 hours |
60 min |
60 min |
| ukmo |
britain |
24 hours |
0 hours |
48 hours |
60 min |
15 min (07,22,37,52) |
| knmi |
netherlands |
6 hours |
6 hours |
45 hours |
10 min |
10 min |
| knmikal |
netherlands |
6 hours |
6 hours |
45 hours |
10 min |
10 min |
| mumm |
belgium |
12 hours |
6 hours |
120 hours |
10 min |
10 min |
| fcoo |
denmark |
6 hours |
0 hours |
54 hours |
15 min |
15 min |
Notes:
knmikal : dutch model with kalman filtering
knmi(kal): No forecast for Aberdeen
bsh: No forecast for NorthShields
2008: No data for RoompotBuiten, IJmuiden, Delfzijl, Tregde or Stavanger
We compare one calendar year of observed and hindcasted high waters
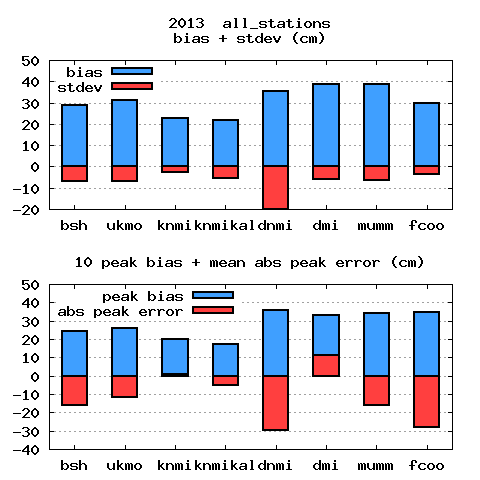
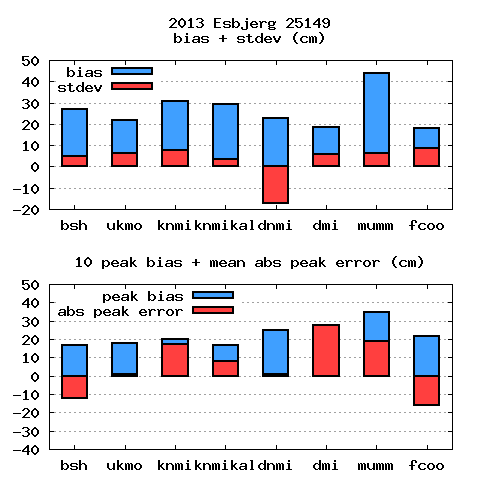
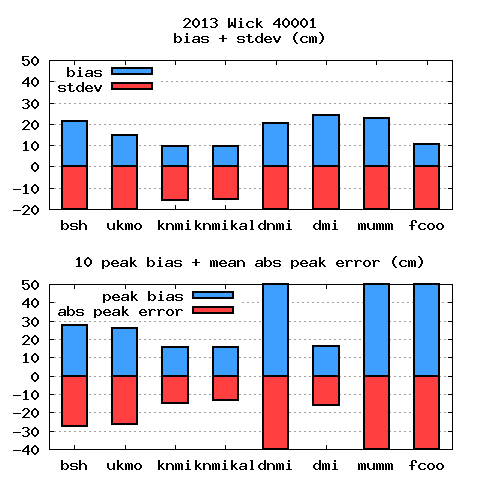
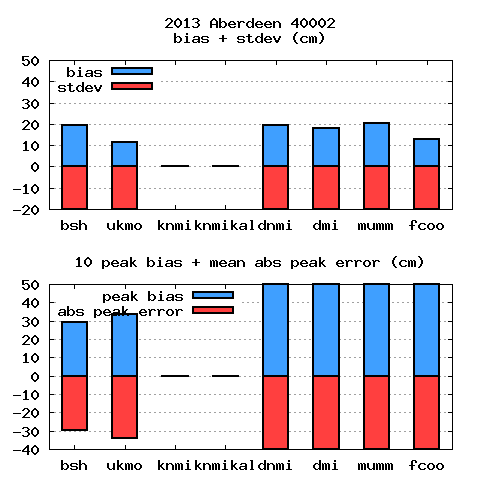
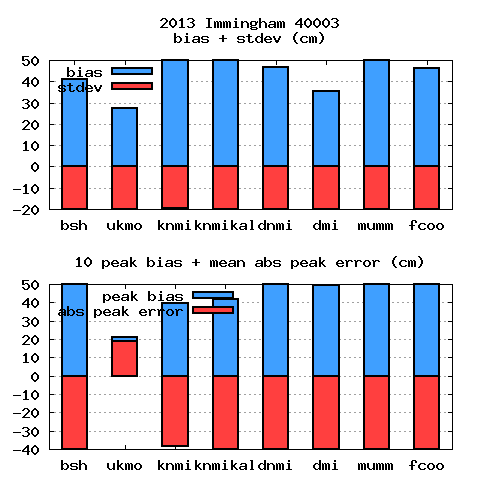
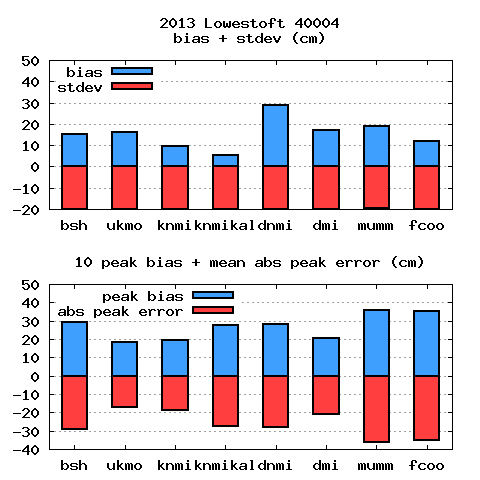
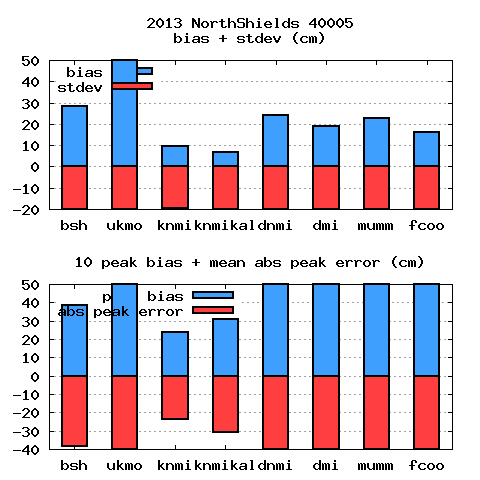
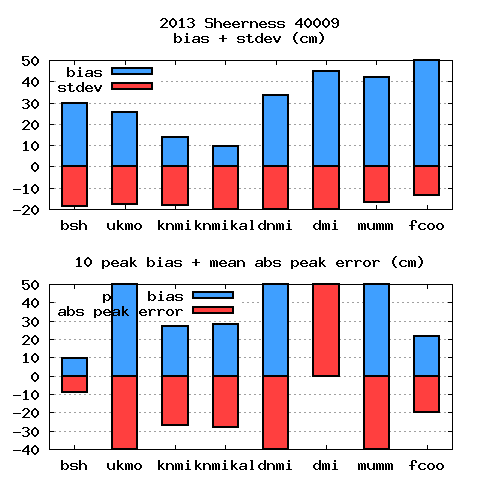
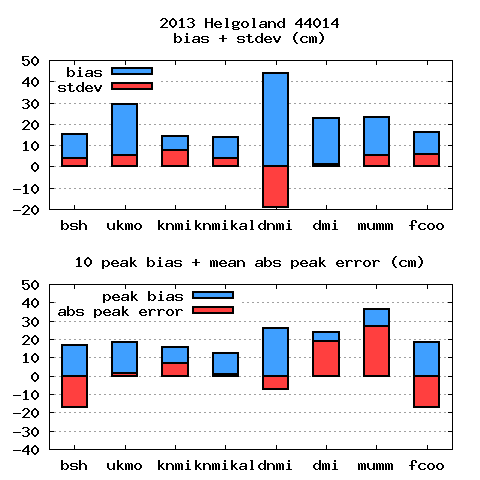
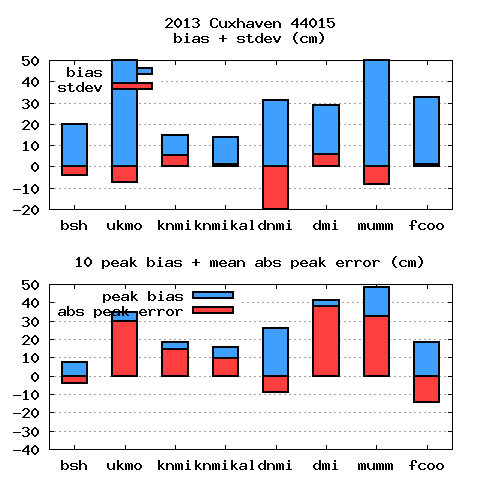
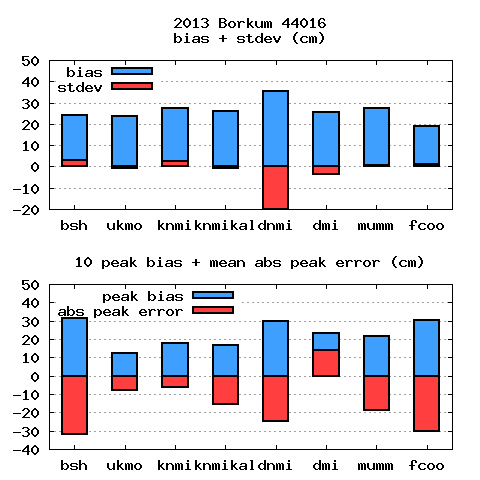
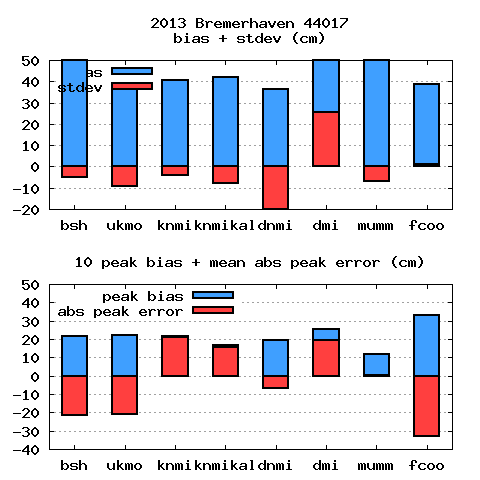
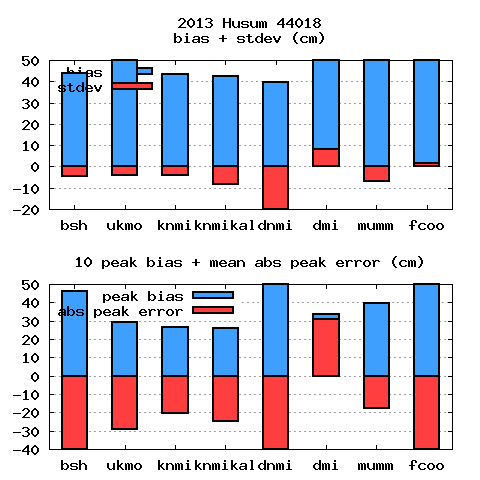
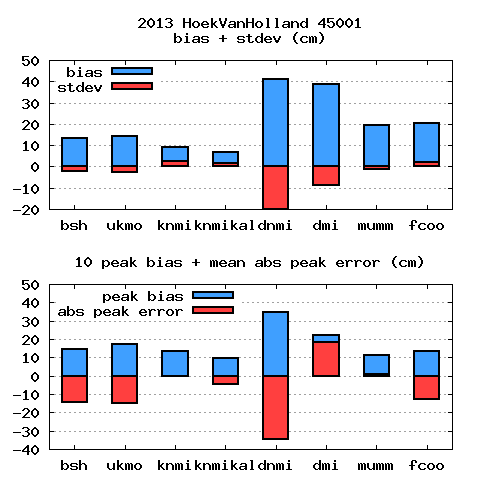
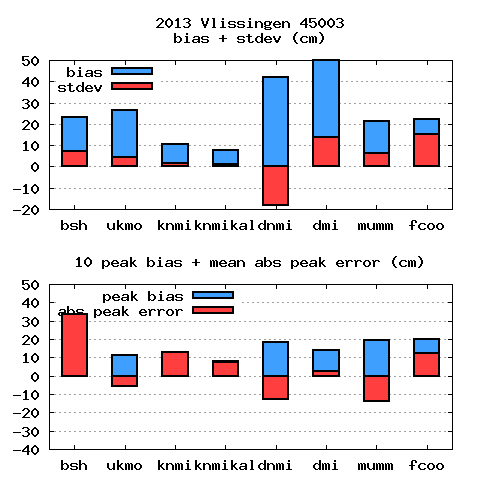
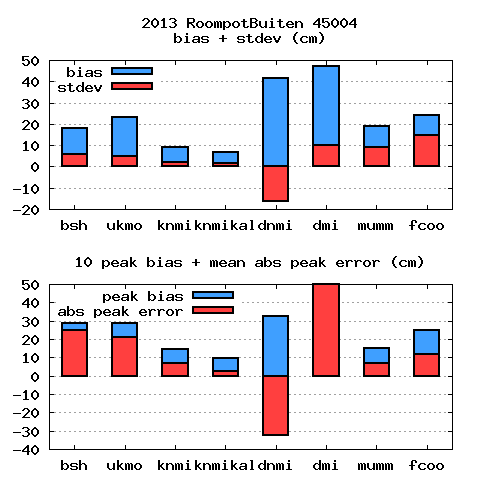
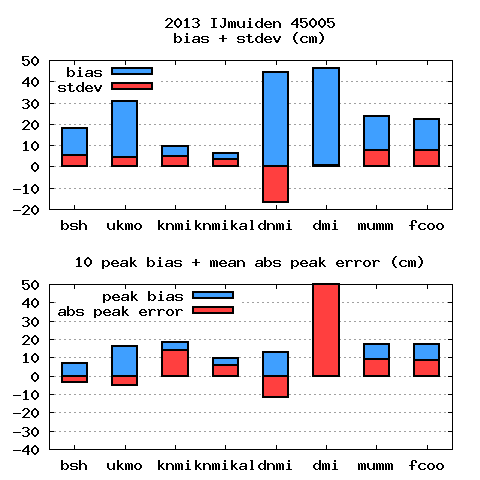
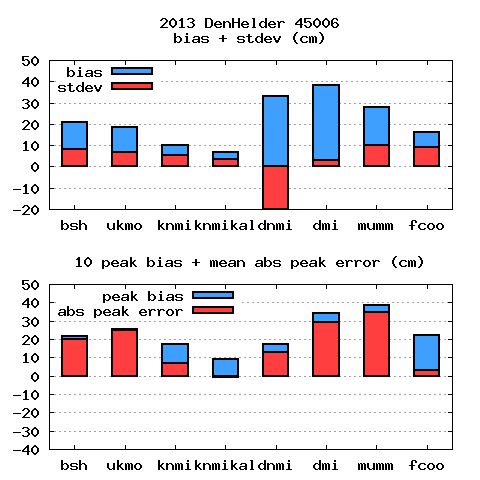
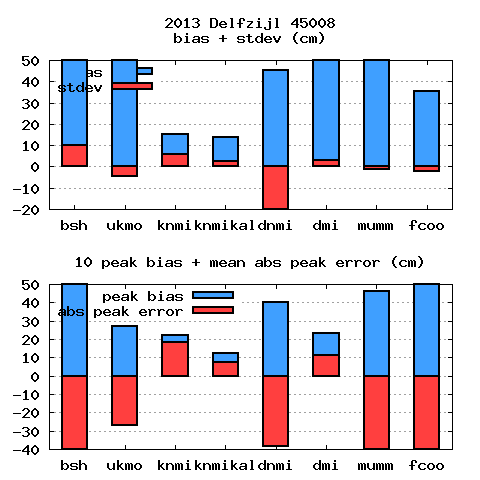
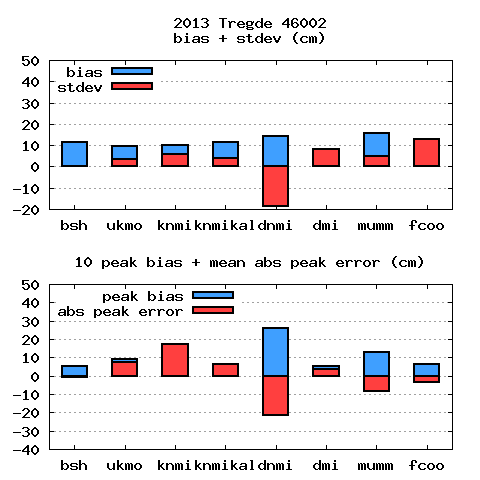
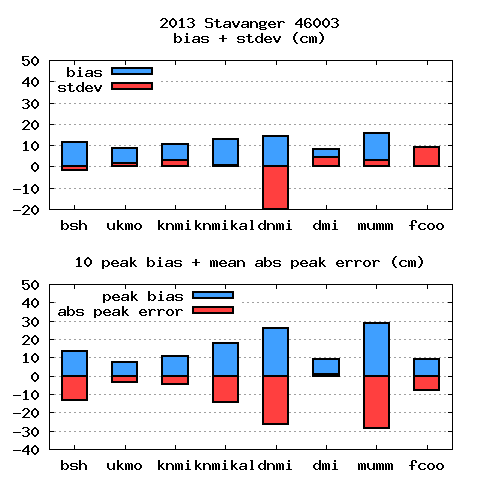
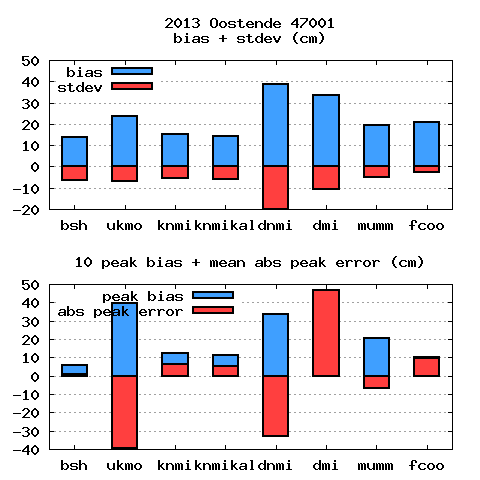
Results - standard errors
mean error (bias)
error standard deviation
peak bias
abs. mean peak error (10 highest peaks).
All stations
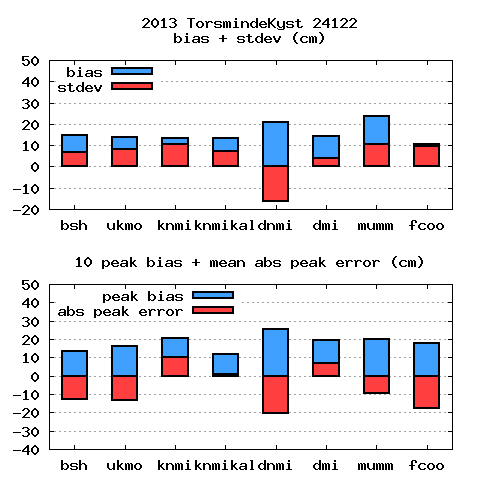
 Single stations (empty plot -> no data)
TorsmindeKyst
Esbjerg
Vidaa
Wick
Aberdeen
Immingham
Lowestoft
NorthShields
Sheerness
Helgoland
Cuxhaven
Borkum
Bremerhaven
Husum
HoekVanHolland
Vlissingen
RoompotBuiten
IJmuiden
DenHelder
Delfzijl
Tregde
Stavanger
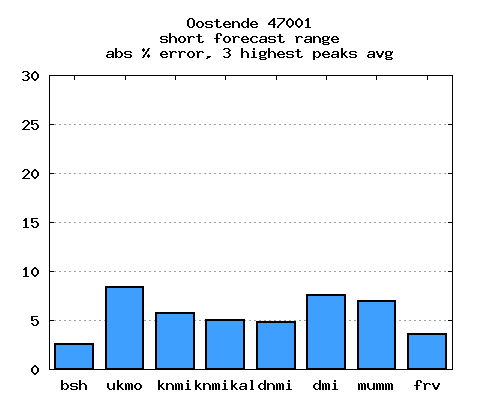
Oostende
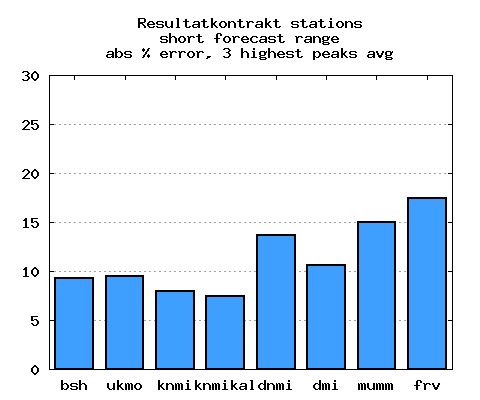
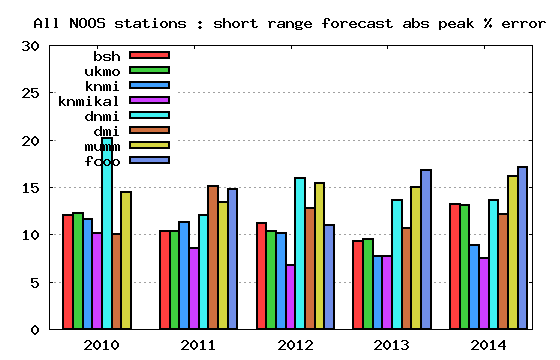
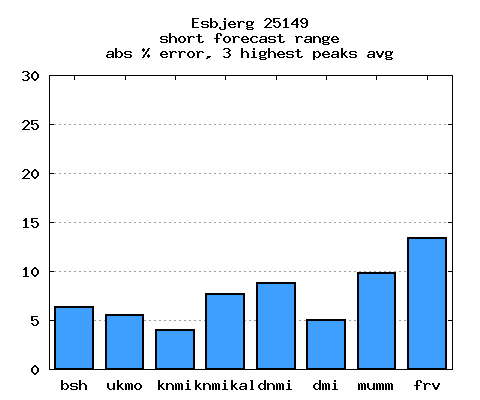
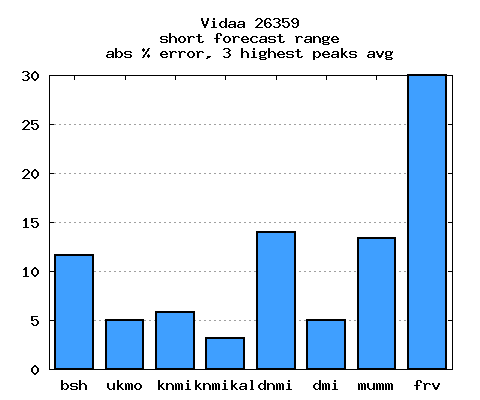
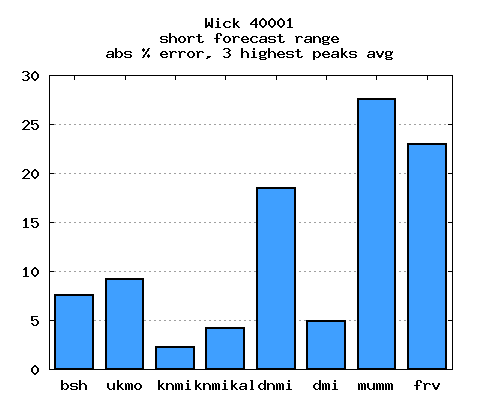
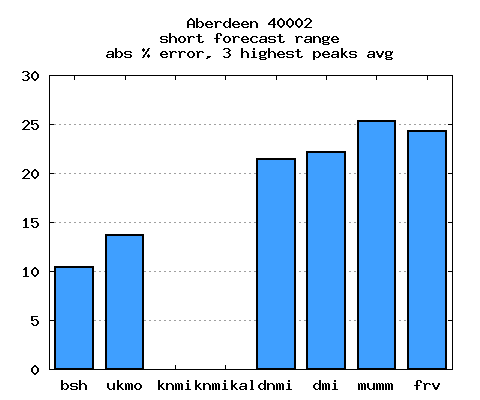
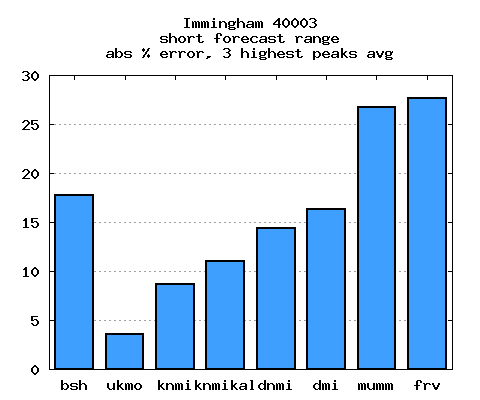
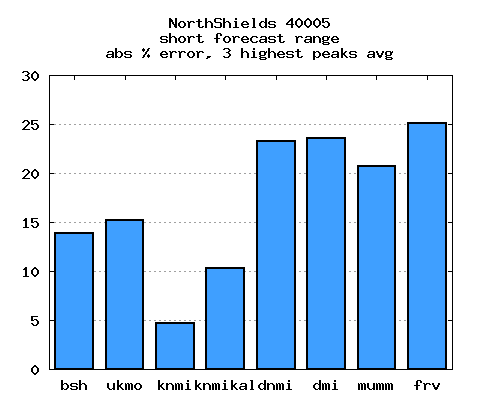
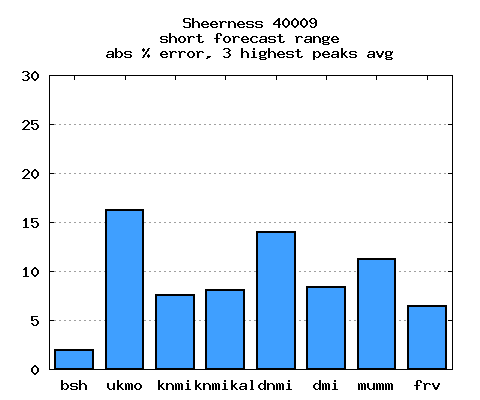
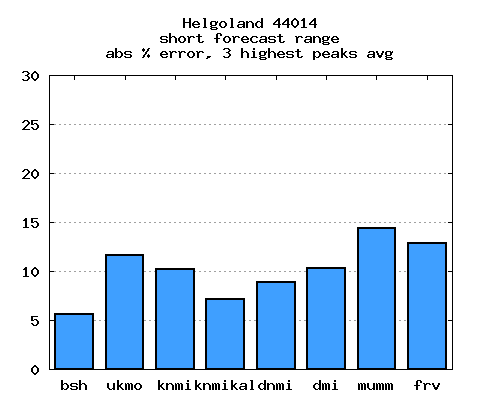
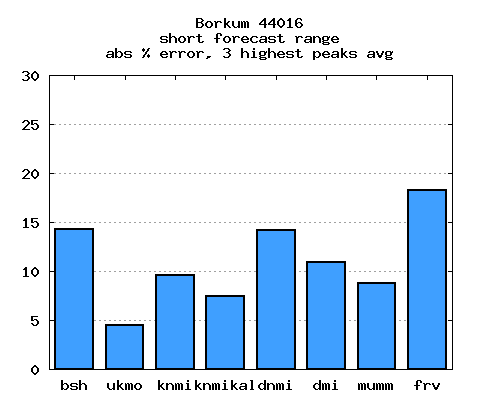
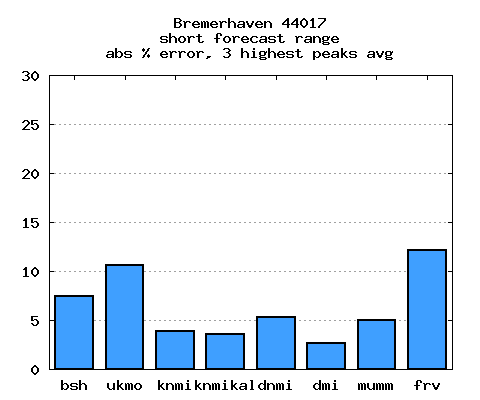
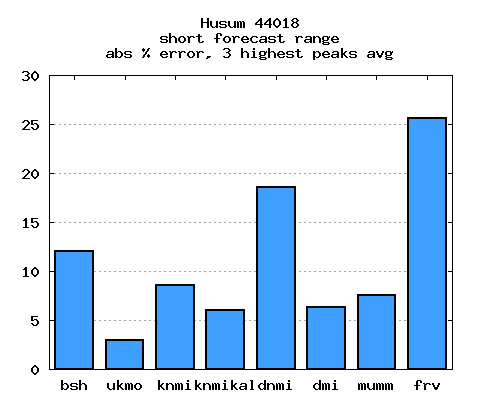
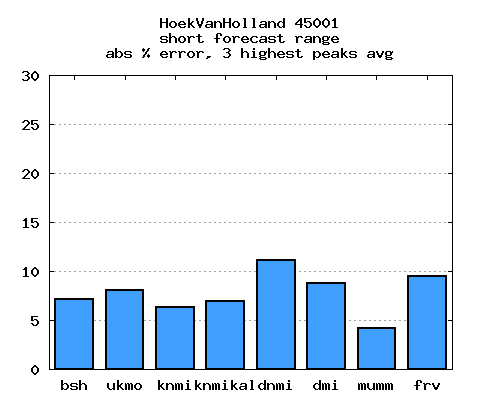
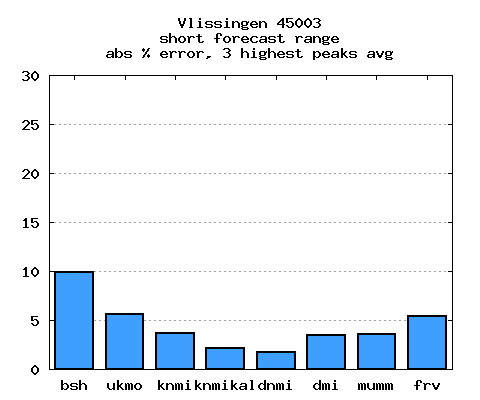
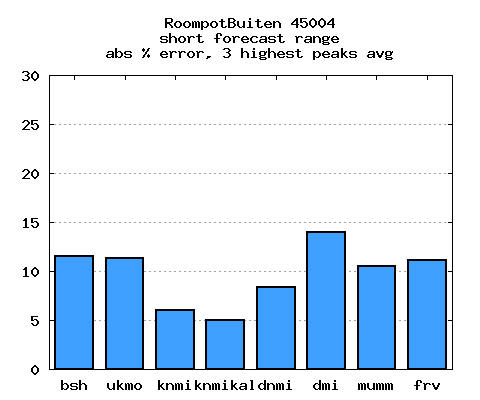
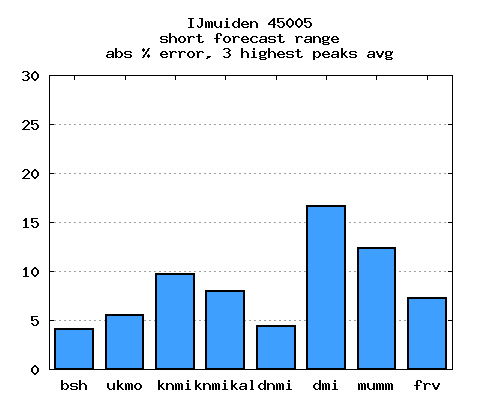
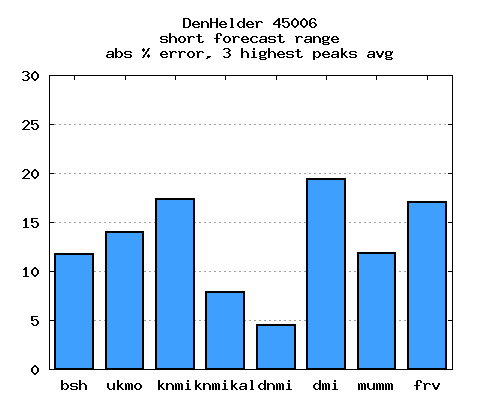
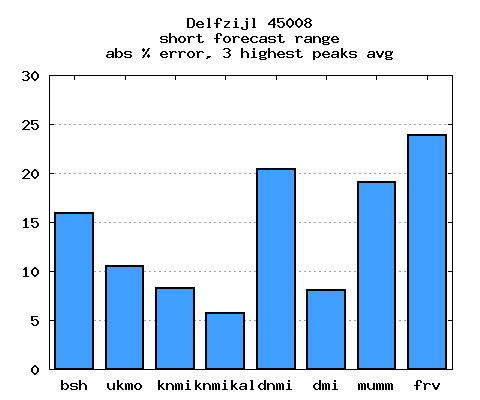
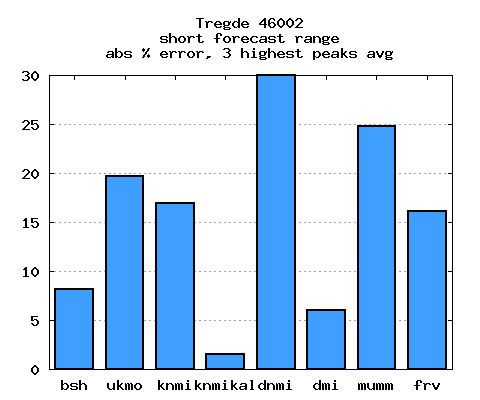
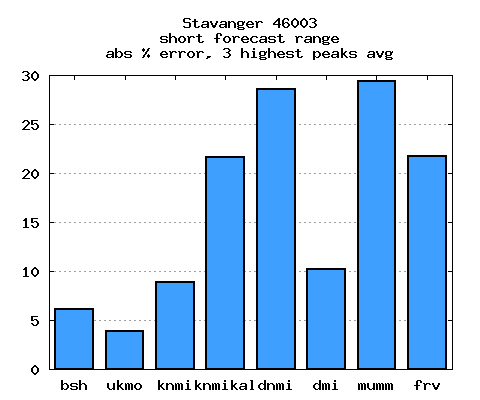
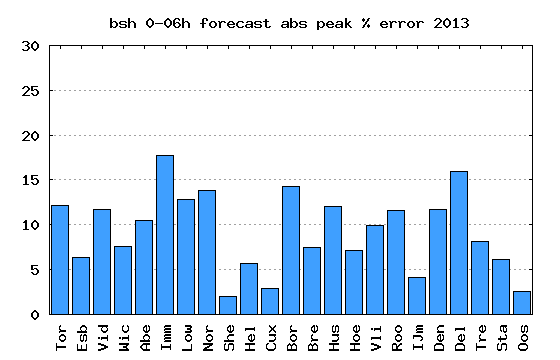
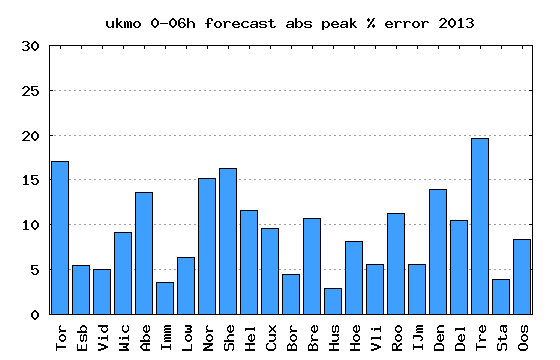
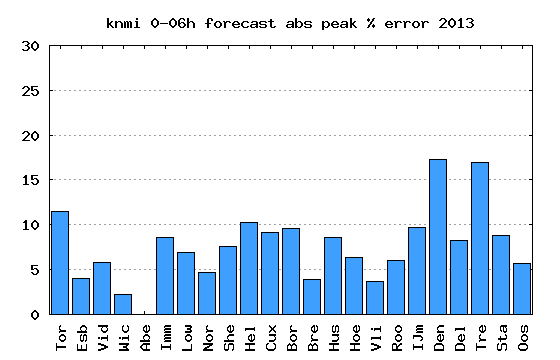
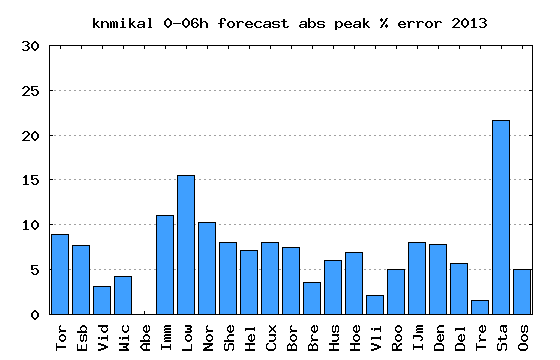
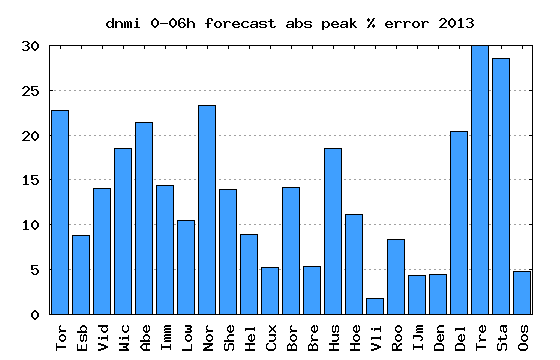
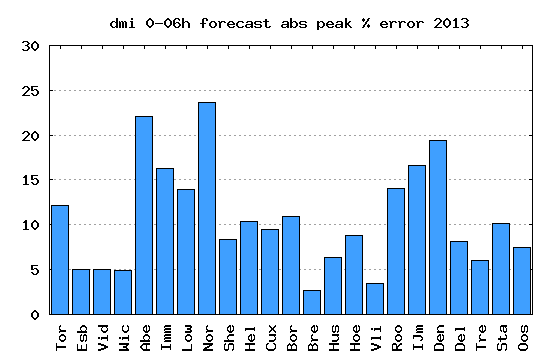
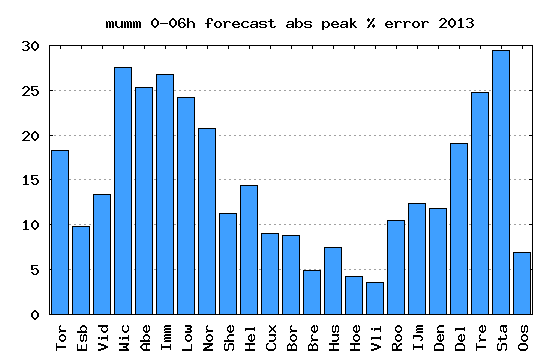
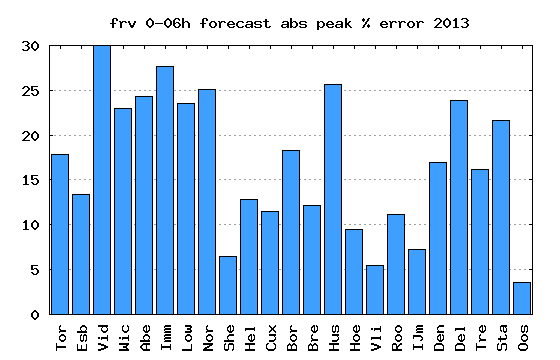
Results - peak errors
abs. mean % peak error (resultatkontrakt, 3 highest peaks).
23 stations
peak table
Single stations (empty plot -> no data)
TorsmindeKyst
Esbjerg
Vidaa
Wick
Aberdeen
Immingham
Lowestoft
NorthShields
Sheerness
Helgoland
Cuxhaven
Borkum
Bremerhaven
Husum
HoekVanHolland
Vlissingen
RoompotBuiten
IJmuiden
DenHelder
Delfzijl
Tregde
Stavanger
Oostende
For each model
bsh
ukmo
knmi
knmikal
dnmi
dmi
mumm
fcoo
Several years