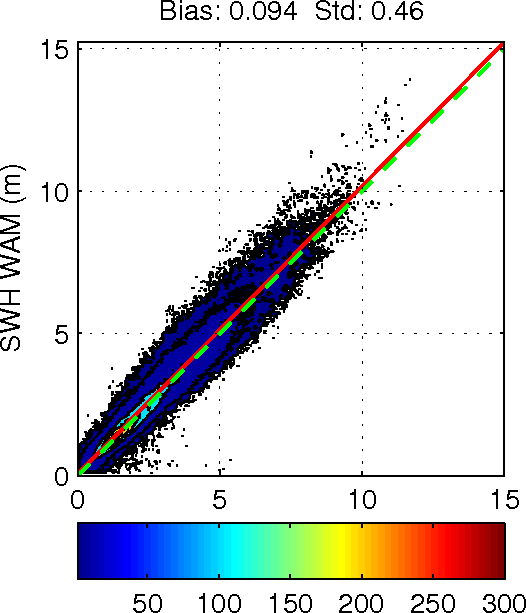
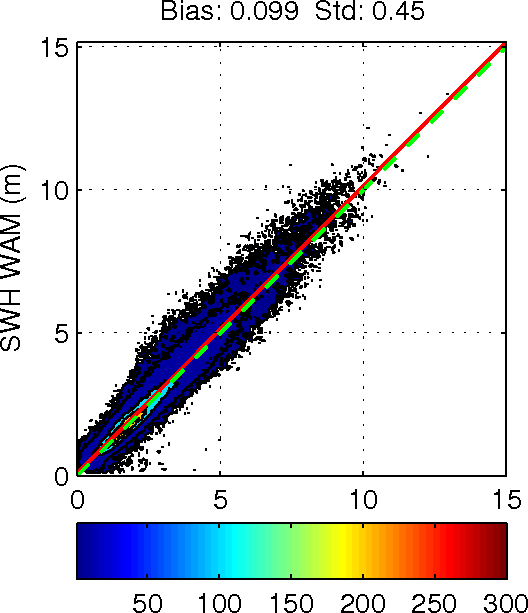
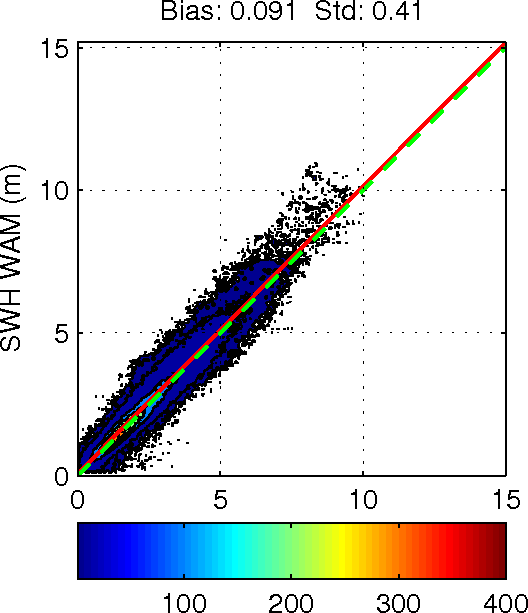
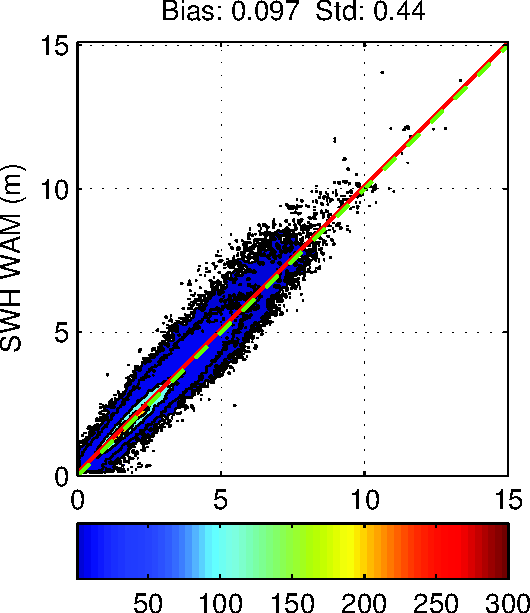
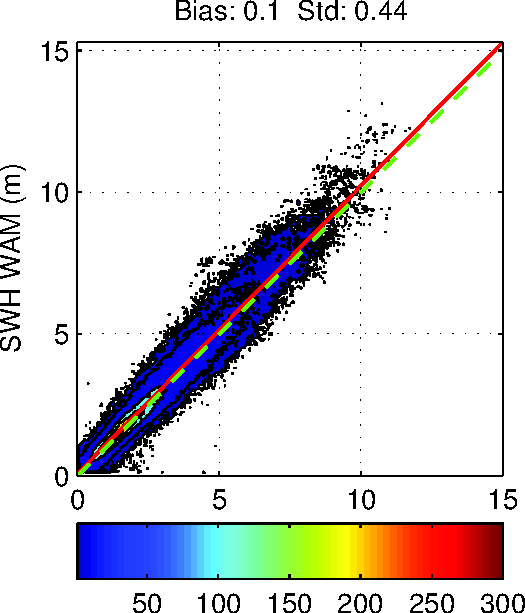
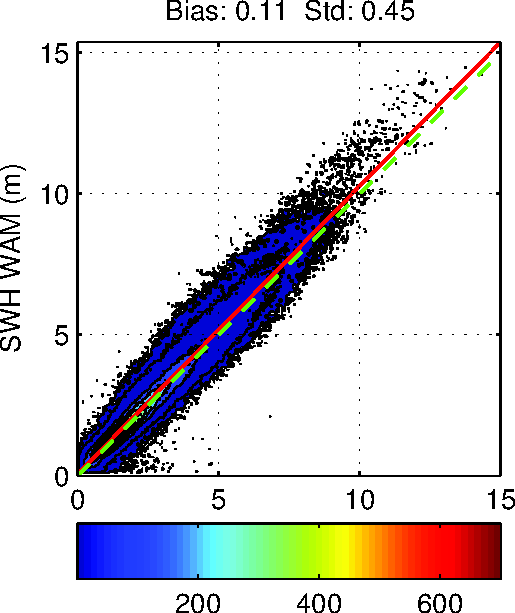
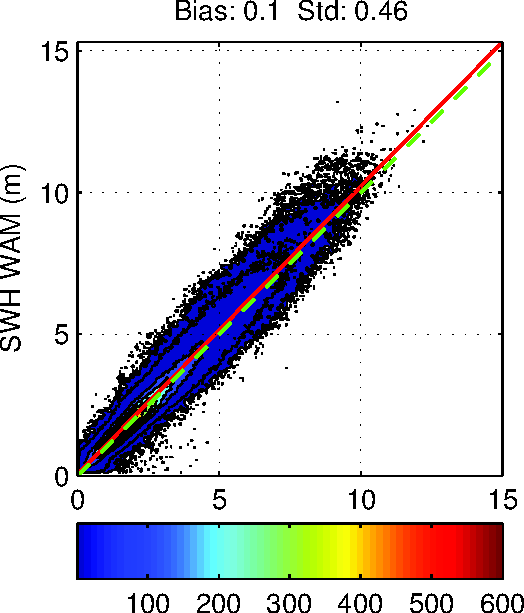
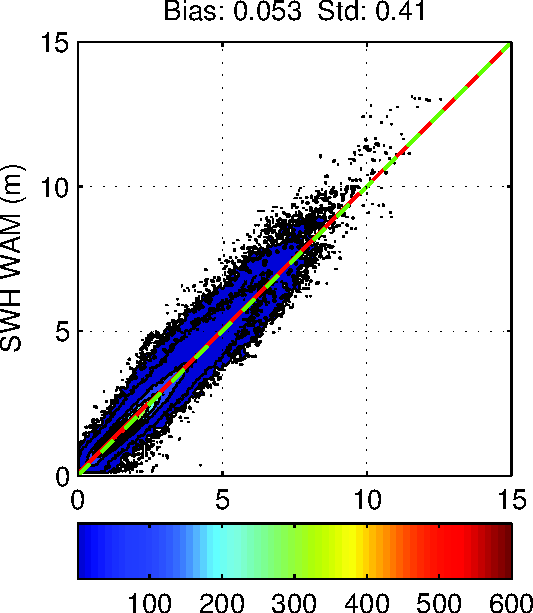
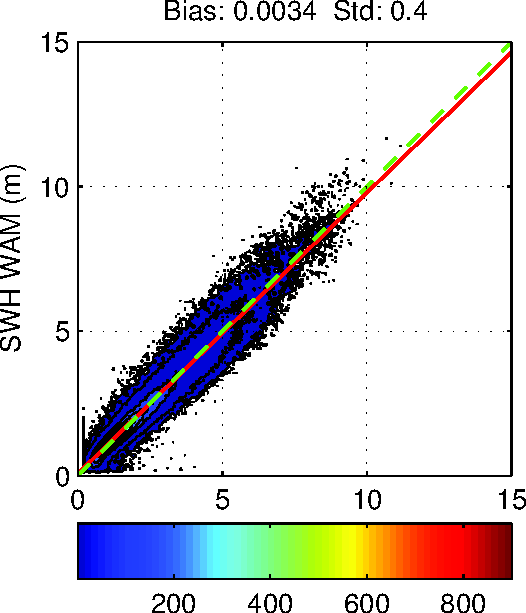
All pairs of WAM (0-6 hour) and satellite observations have been used.
The number of observations in each 5x5 cm box is shown with
colors. The red line represents the best fit to the data whereas the
green dashed line represents a one to one relationship.
2011_07-12
2012_01-06
2012_07-12
2013_01-06
2013_07-12
2014_01-12
2015_01-12
2016_01-12
2017_01-12
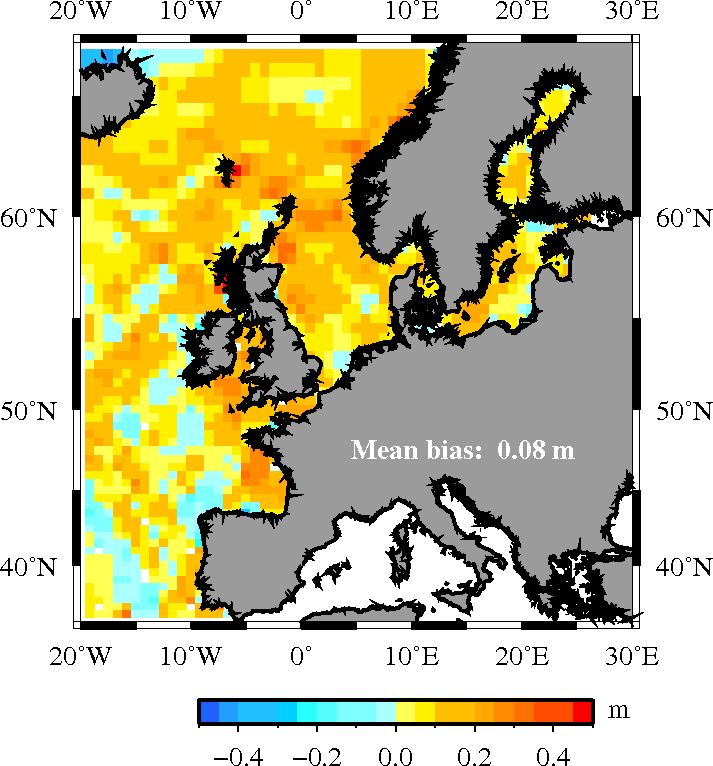
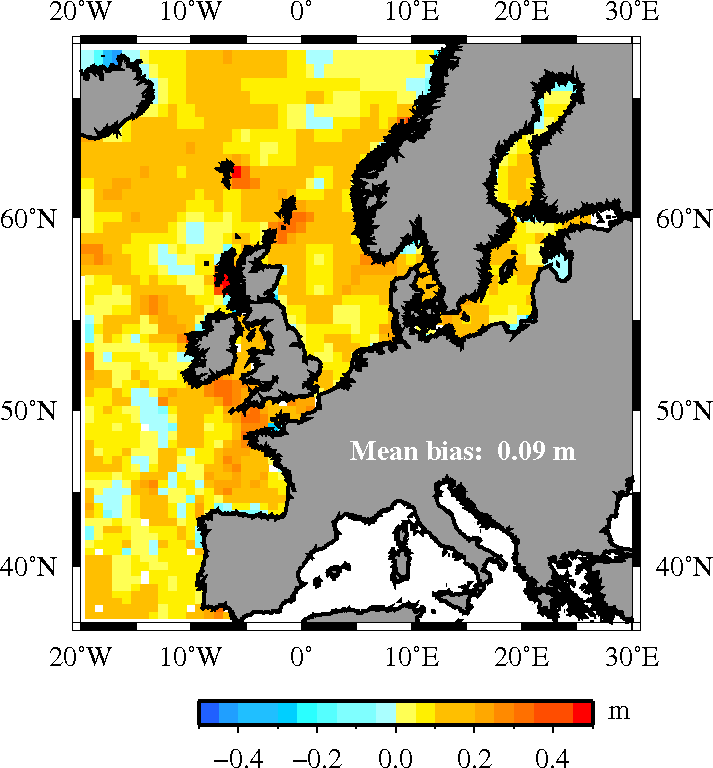
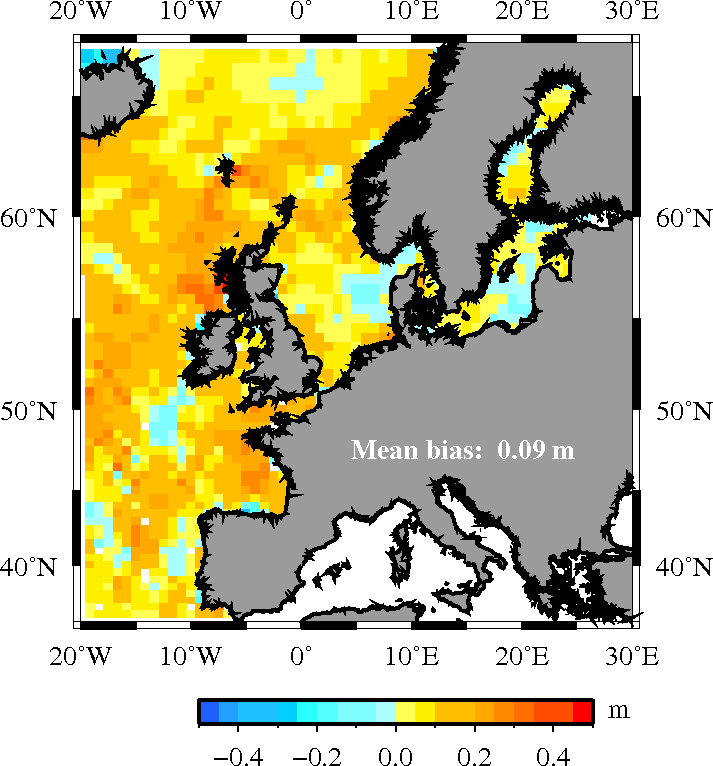
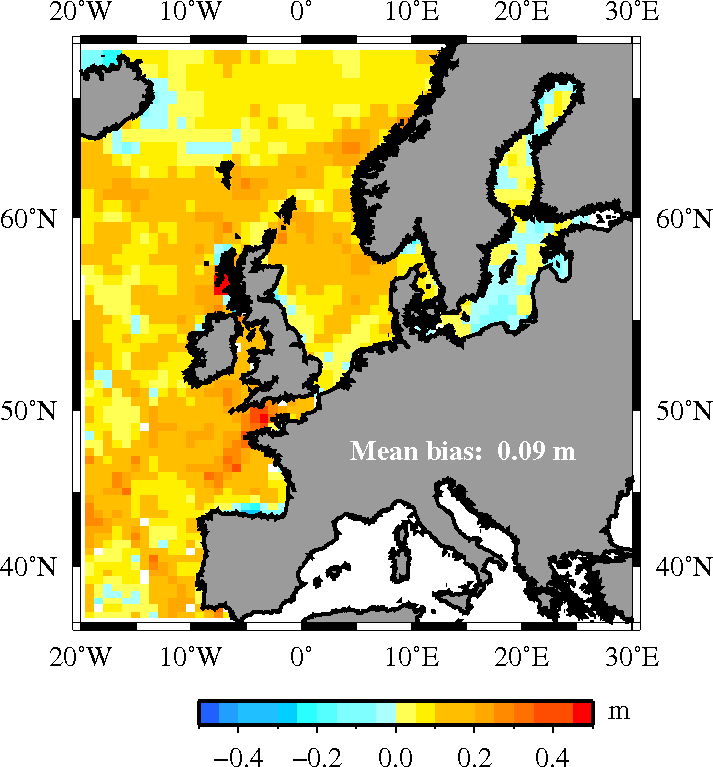
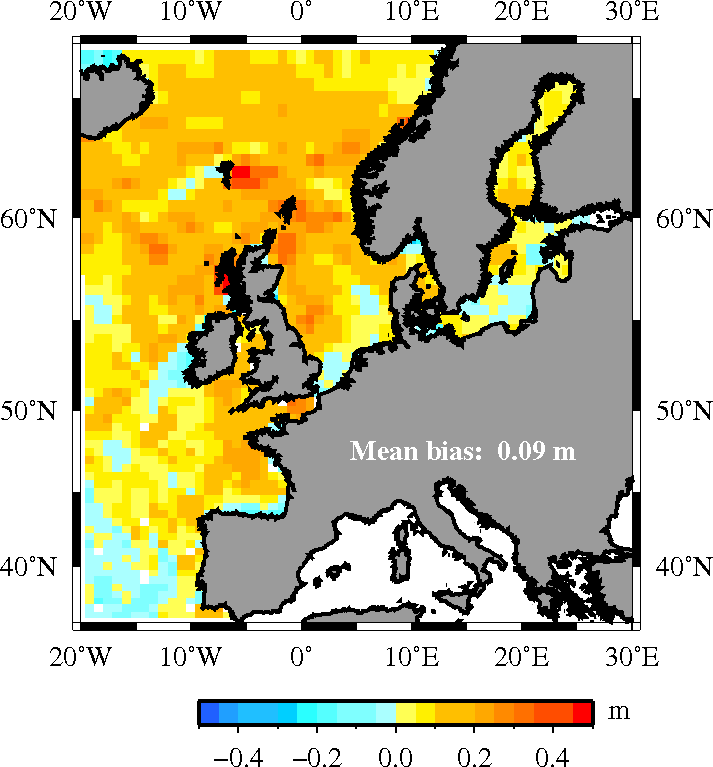
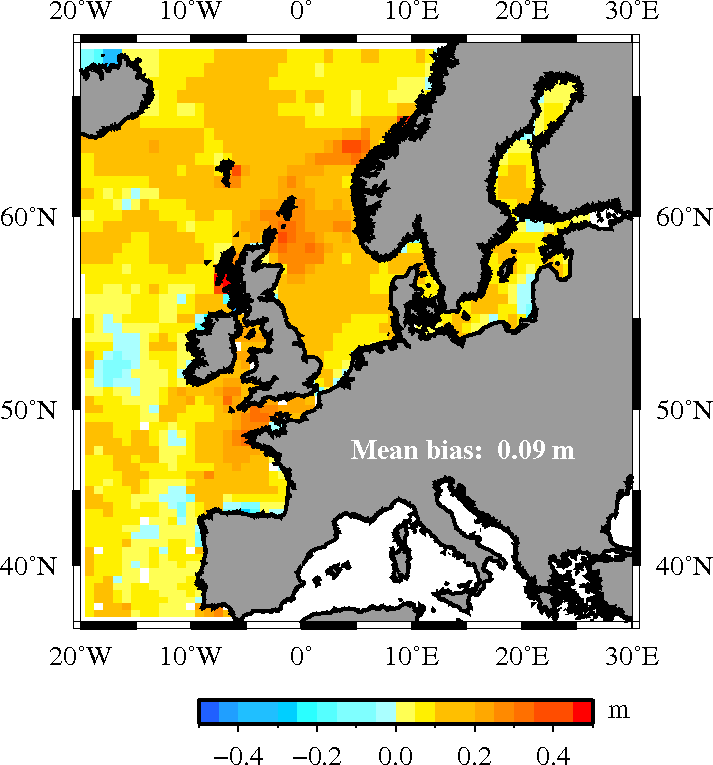
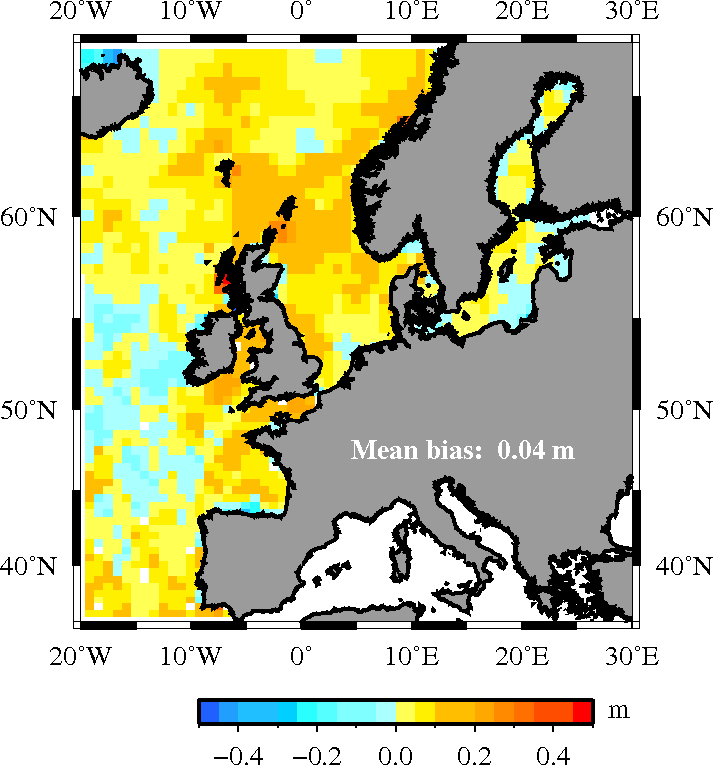
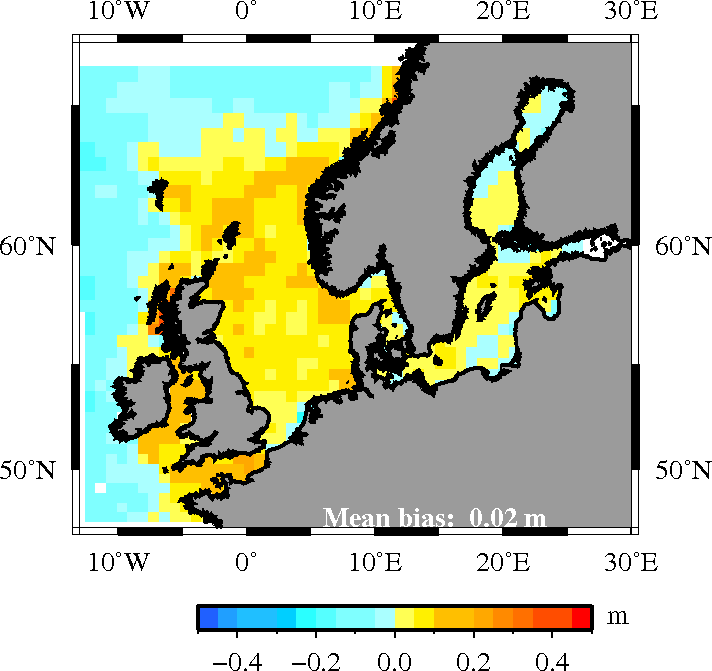
Errors in 2 dimensions
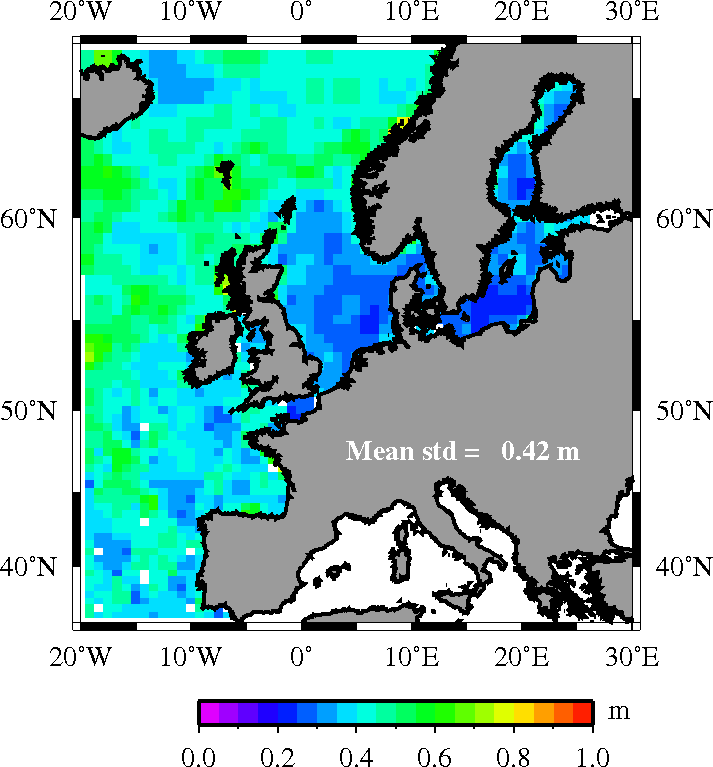
Average error statistics have been calculated over 100 km bins,
to provide enough observations to obtain reliable 2D error estimates
Bias
2011_07-12
2012_01-06
2012_07-12
2013_01-06
2013_07-12
2014_01-12
2015_01-12
2016_01-12
2017_01-12
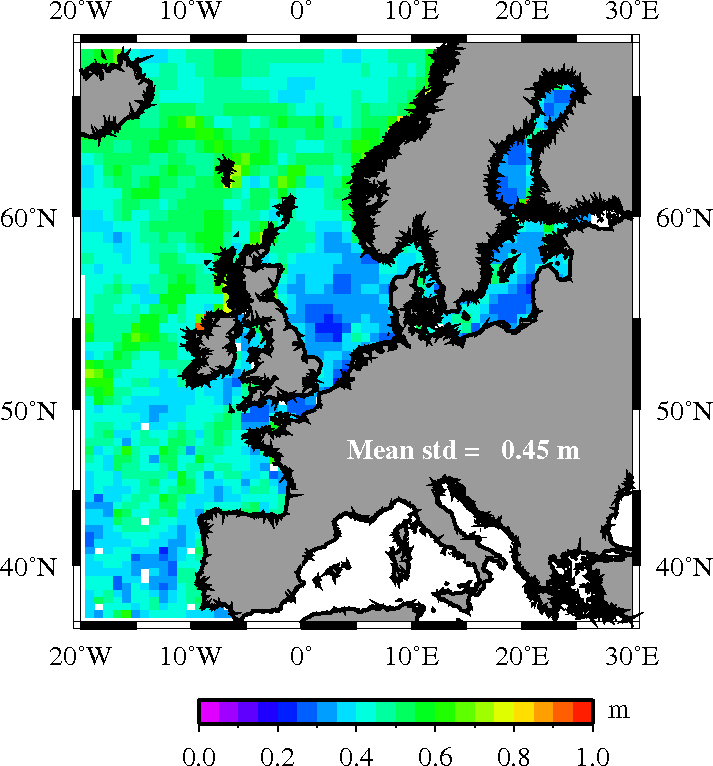
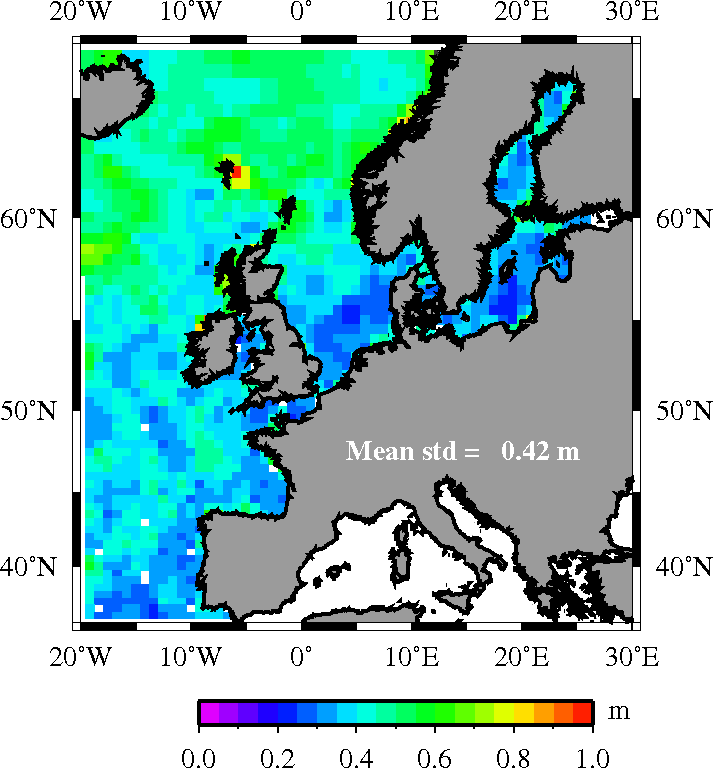
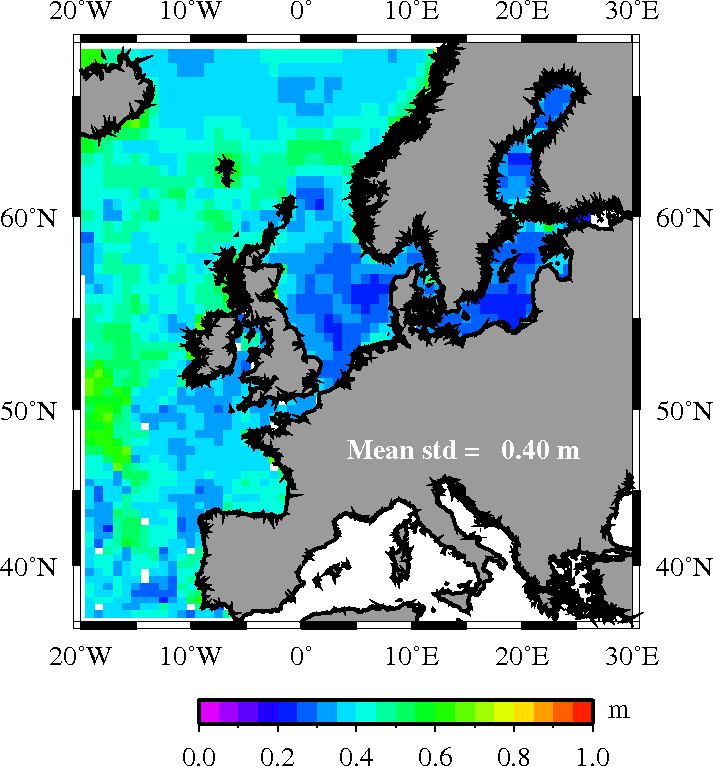
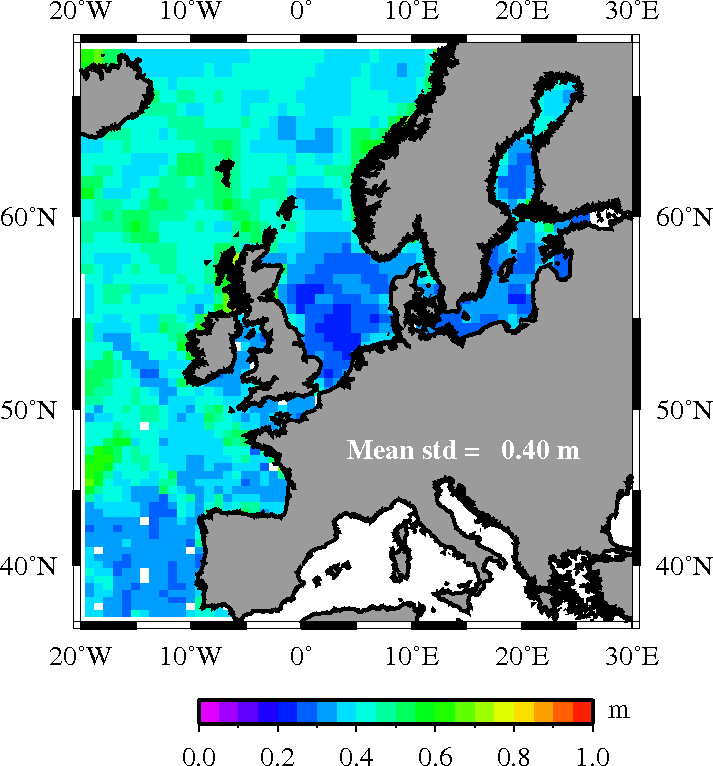
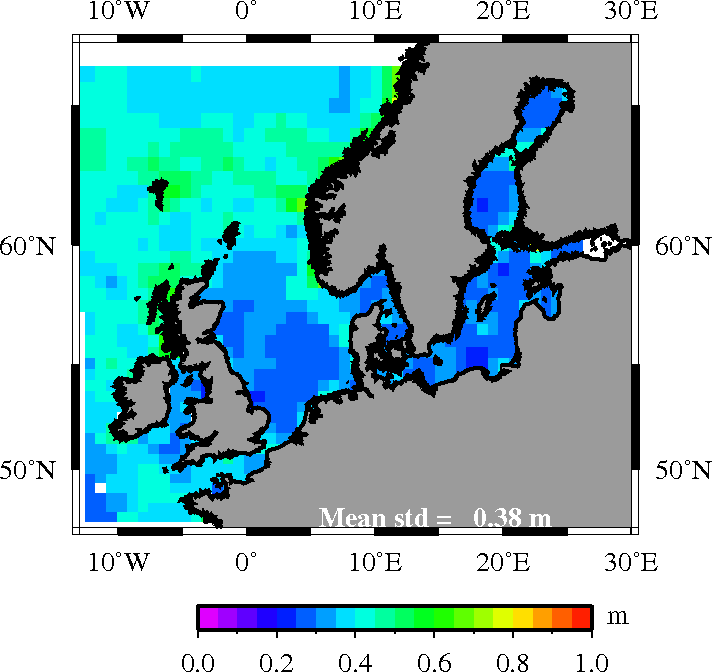
Standard deviation
2011_07-12
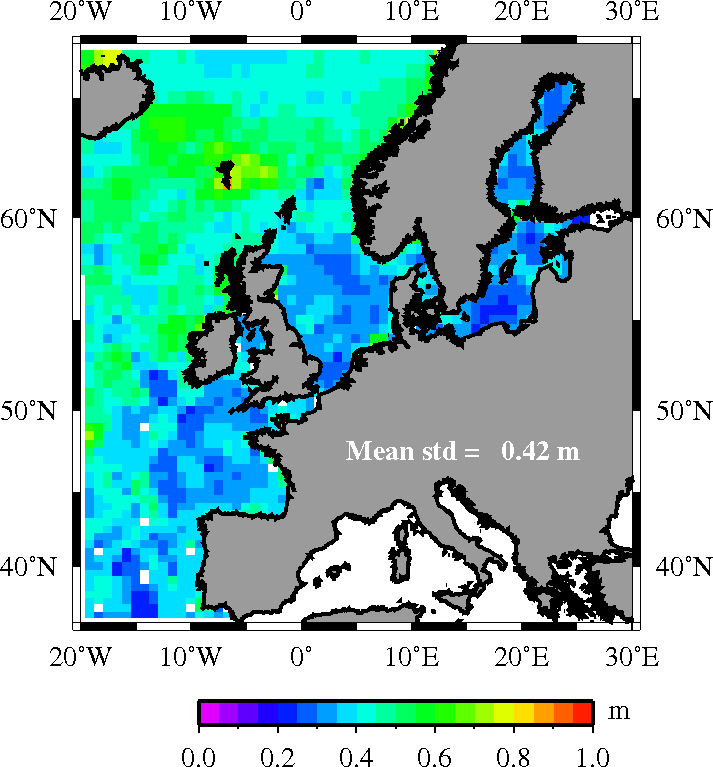
2012_01-06
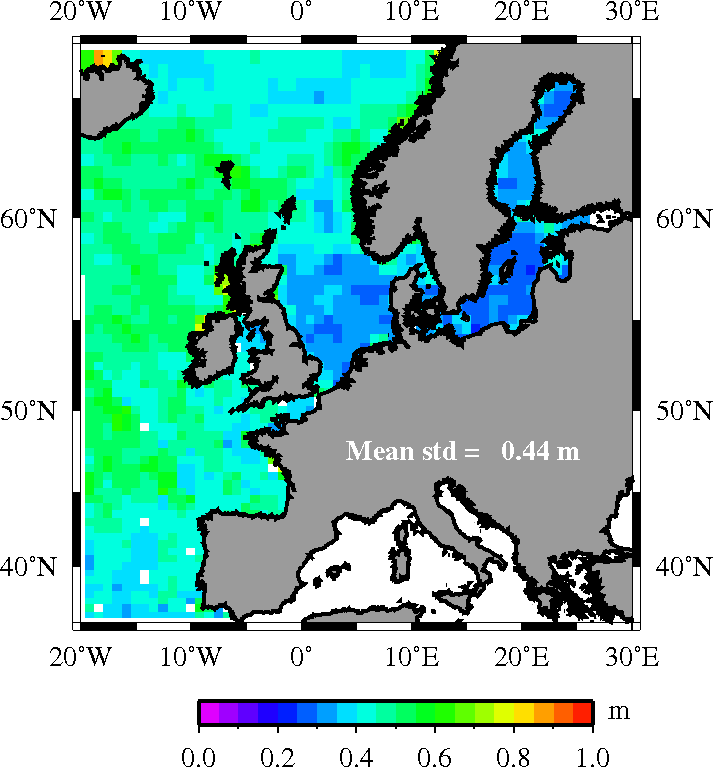
2012_07-12
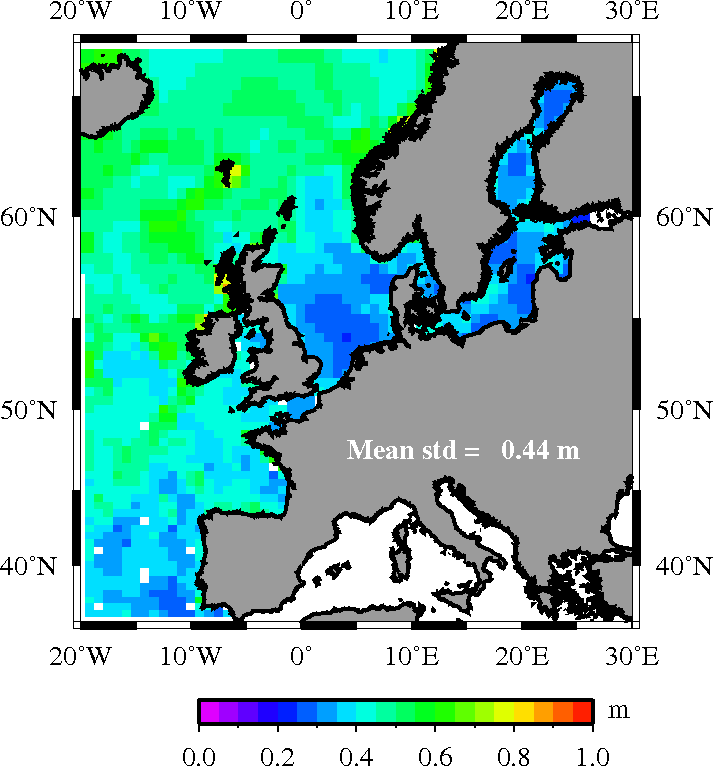
2013_01-06
2013_07-12
2014_01-12
2015_01-12
2016_01-12
2017_01-12
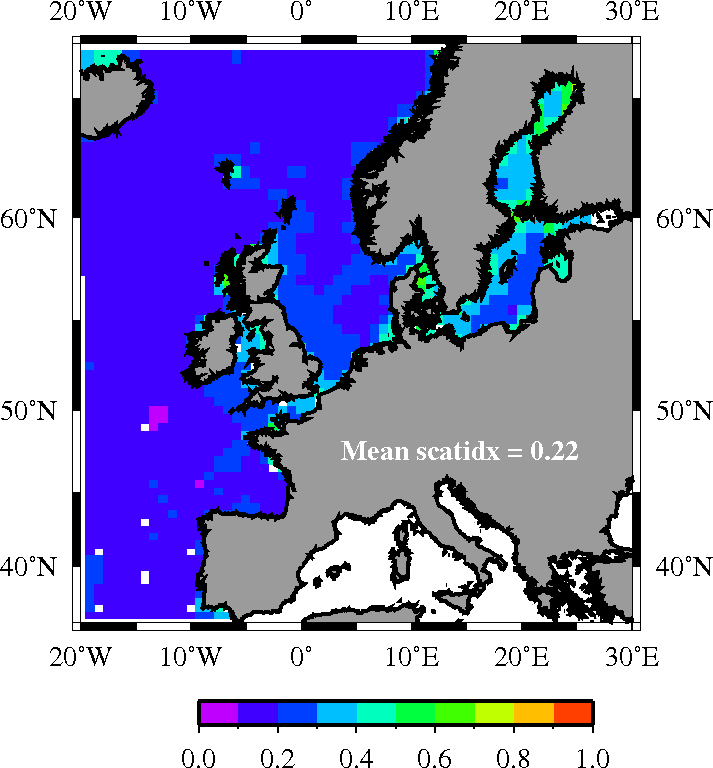
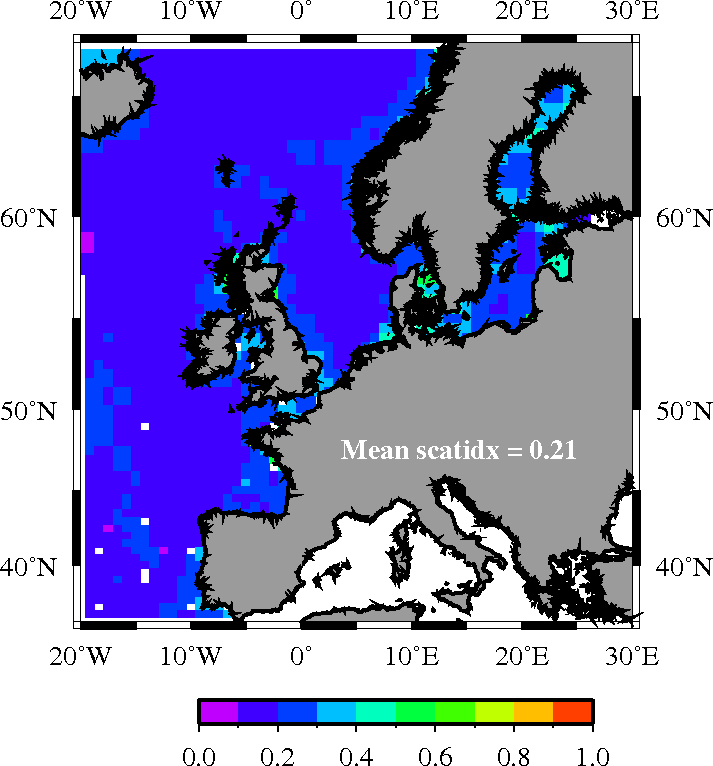
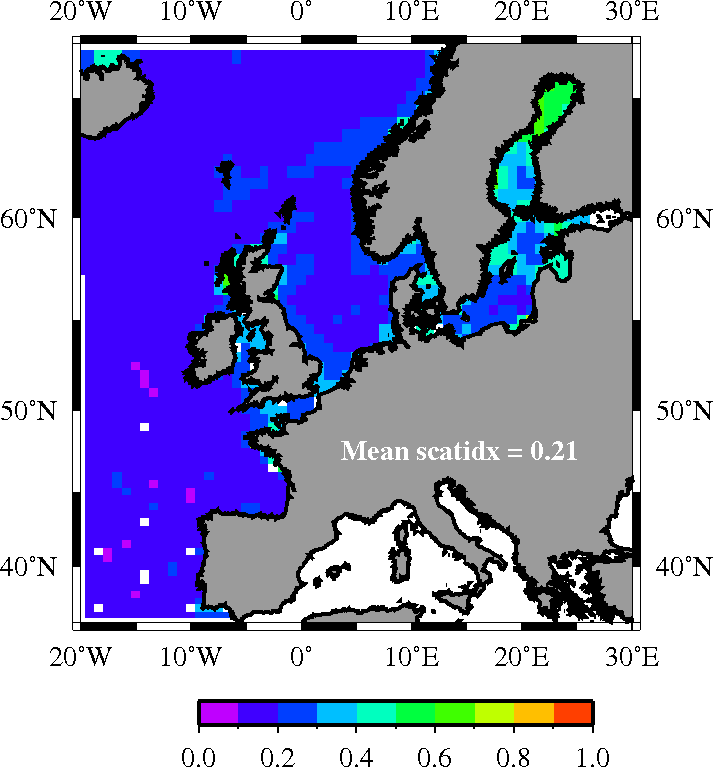
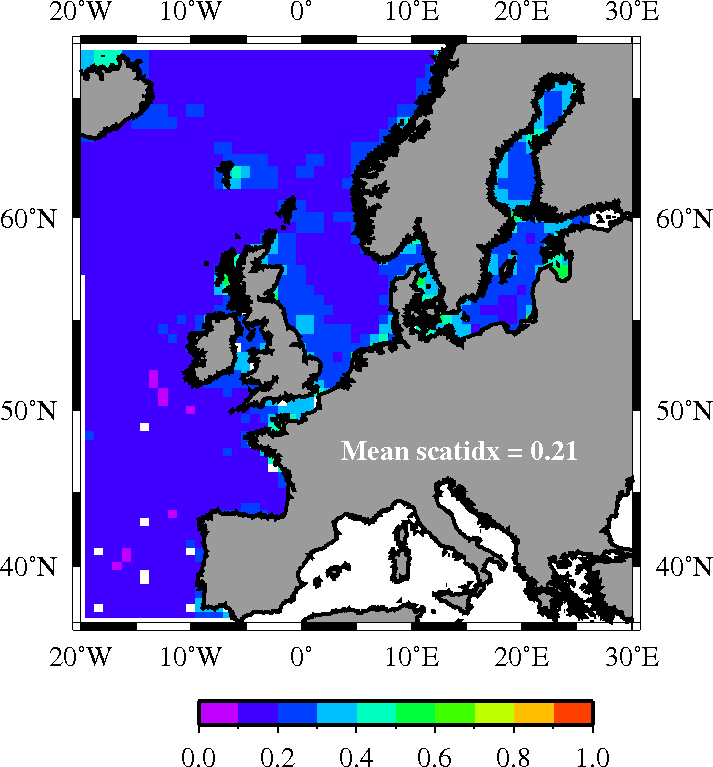
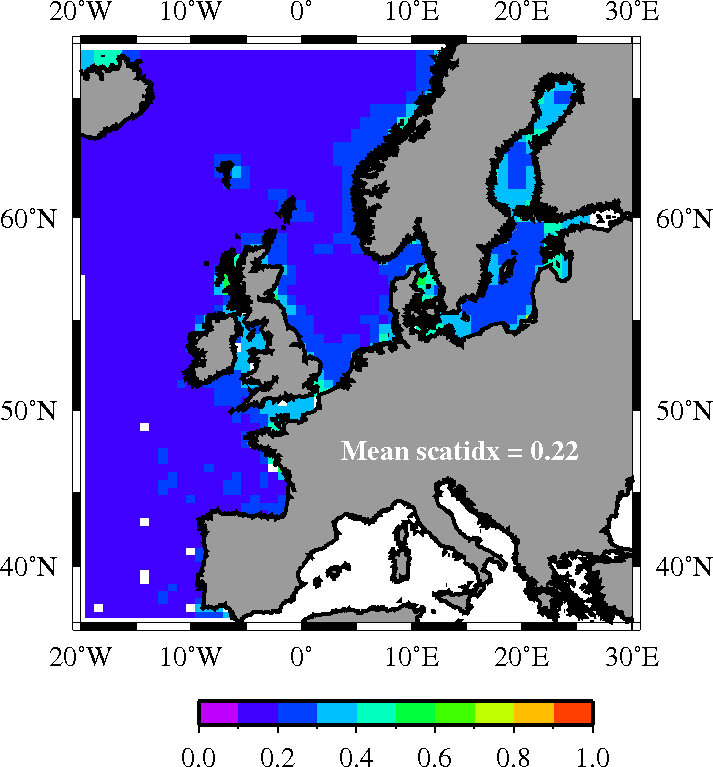
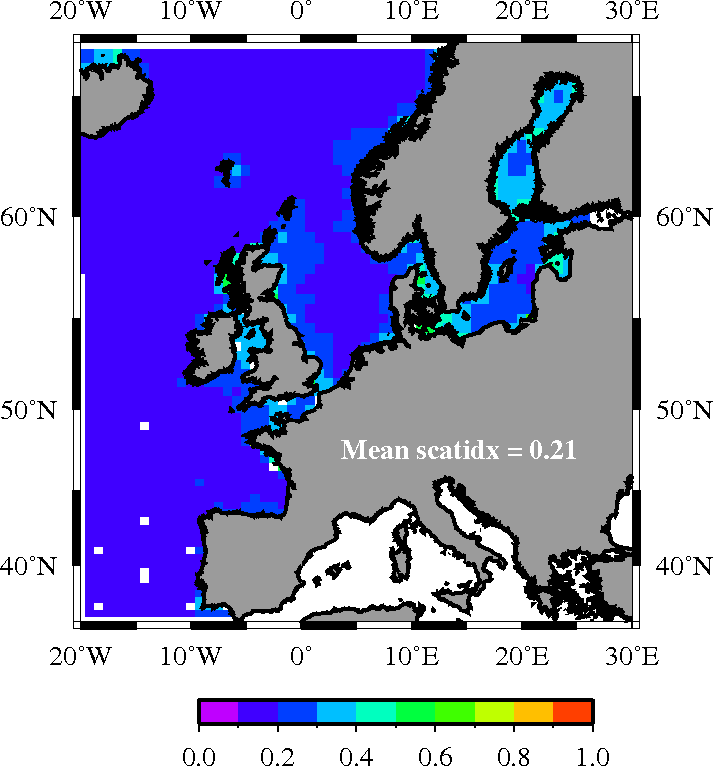
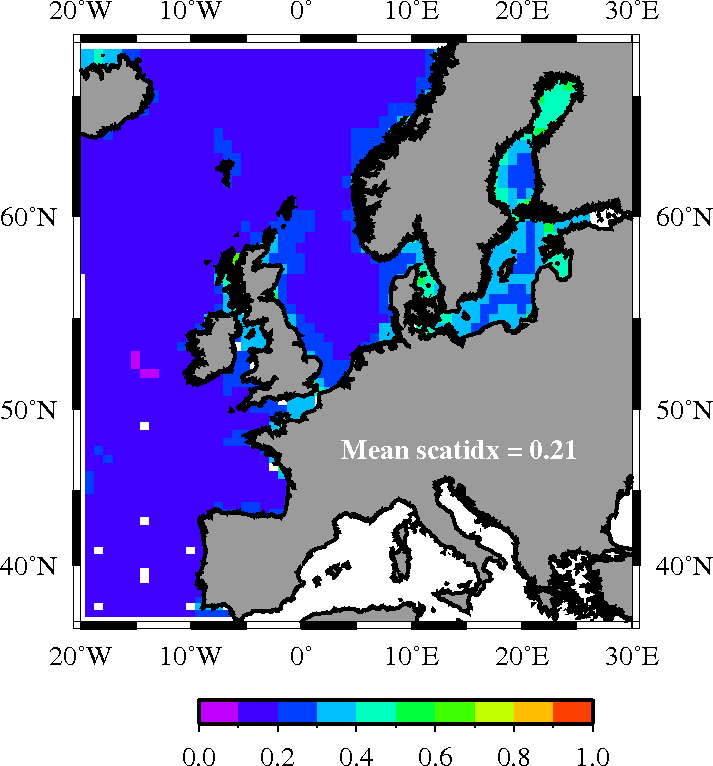
Scatter index
2011_07-12
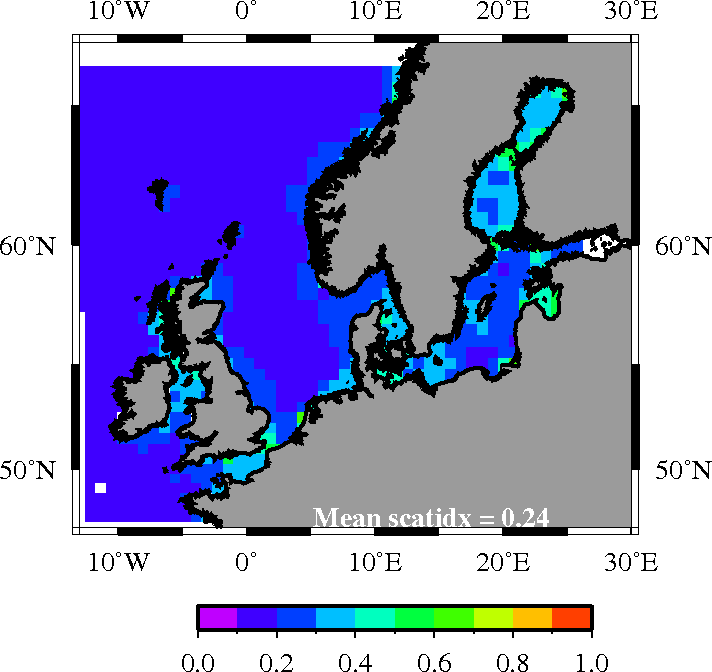
2012_01-06
2012_07-12
2013_01-06
2013_07-12
2014_01-12
2015_01-12
2016_01-12
2017_01-12
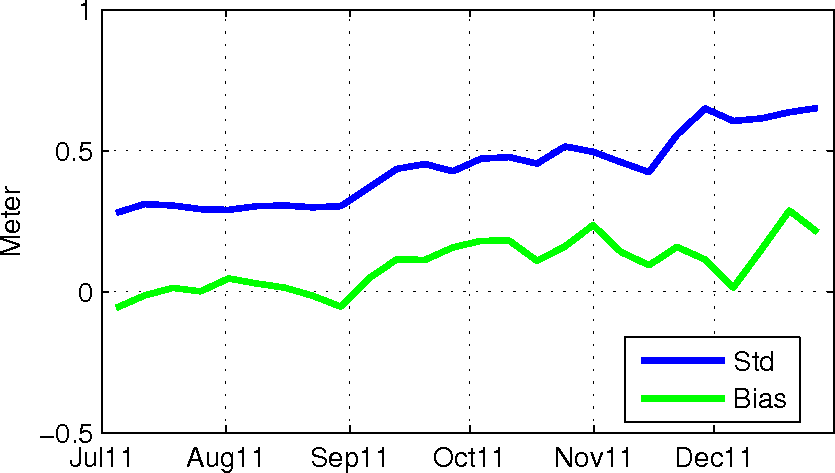
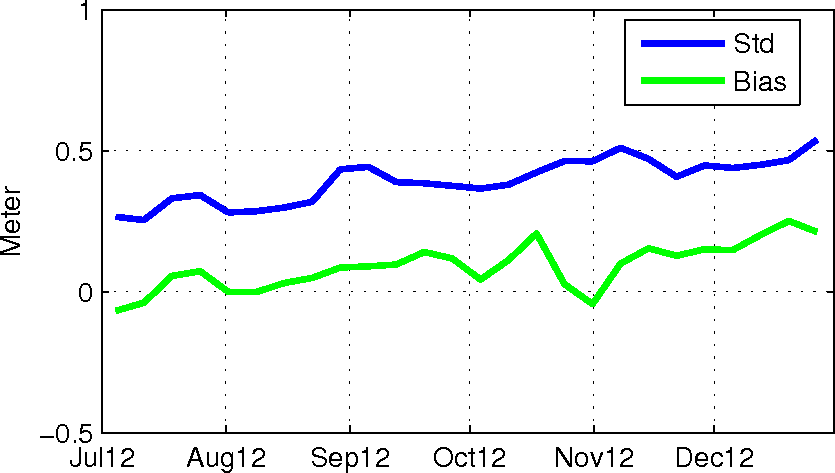
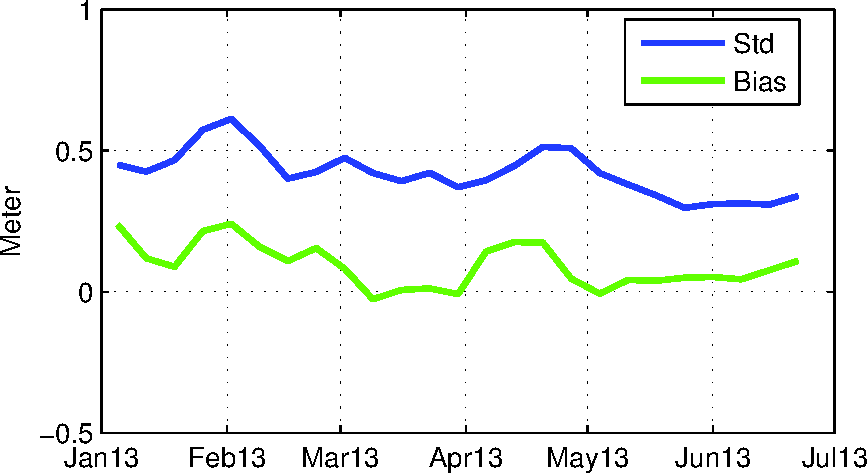
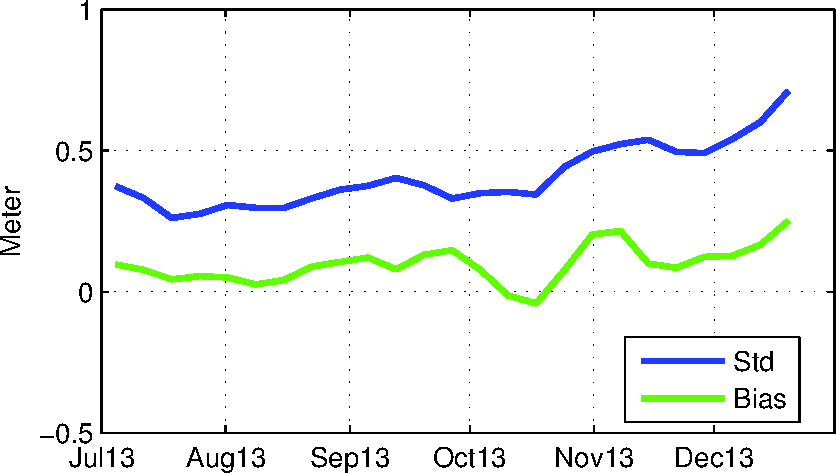
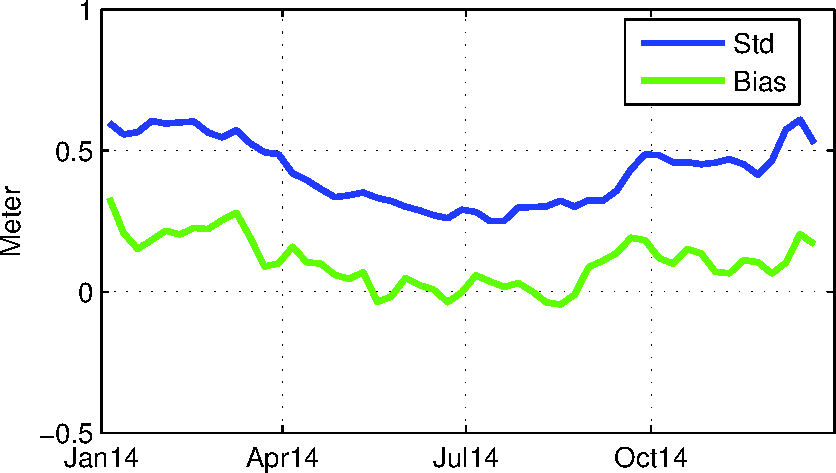
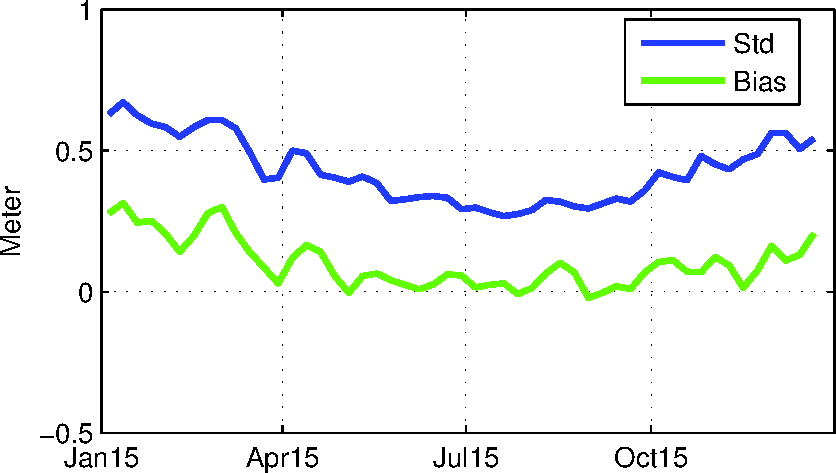
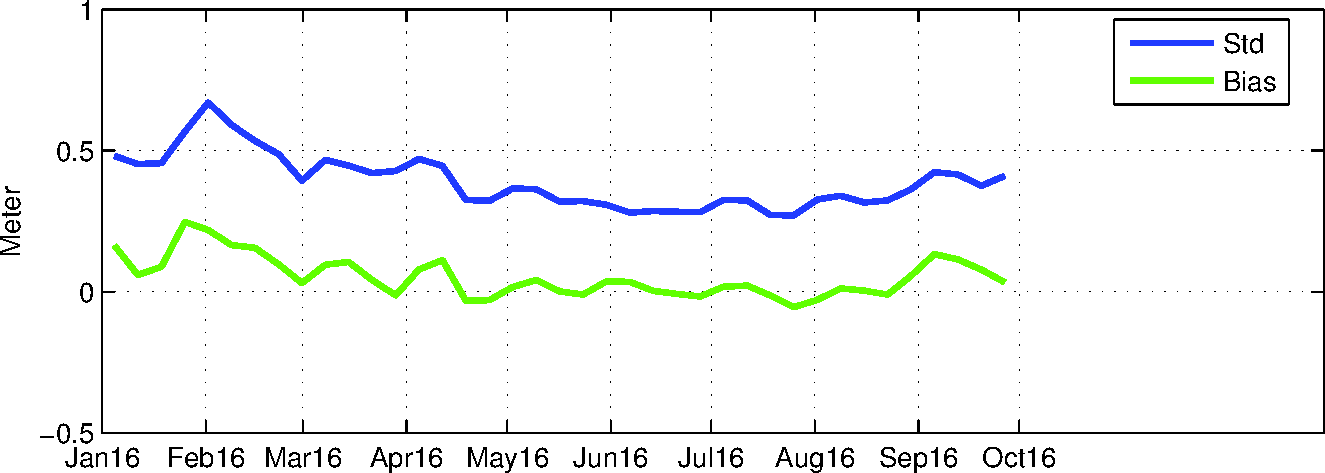
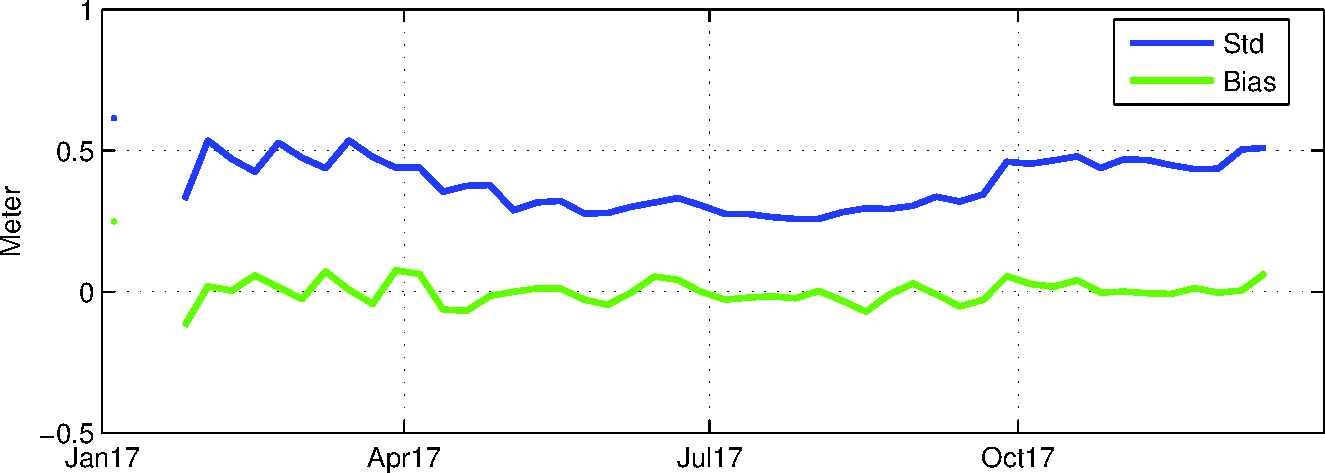
Temporal error statistics:
Bias and stddev have been calculated for weekly averages
2011_07-12
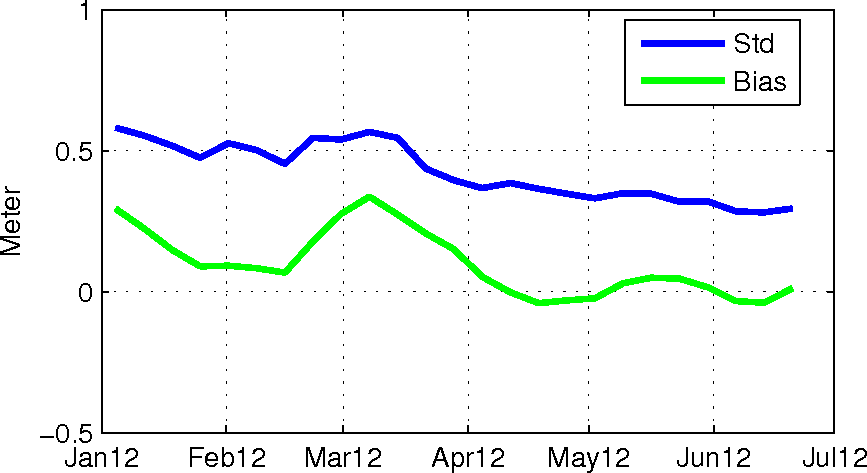
2012_01-06
2012_07-12
2013_01-06
2013_07-12
2014_01-12
2015_01-12
2016_01-12
2017_01-12
....................
Jacob Woge Nielsen, Jacob L Hřyer - May 16th 2018
Ocean and Ice - Danish Meteorological Institute - Sankt Kjelds Plads 11
- 2100 Copenhagen Ø - Denmark. Phone: +45 39 15 75 00 -
Contact DMI