Sea Ice Extent
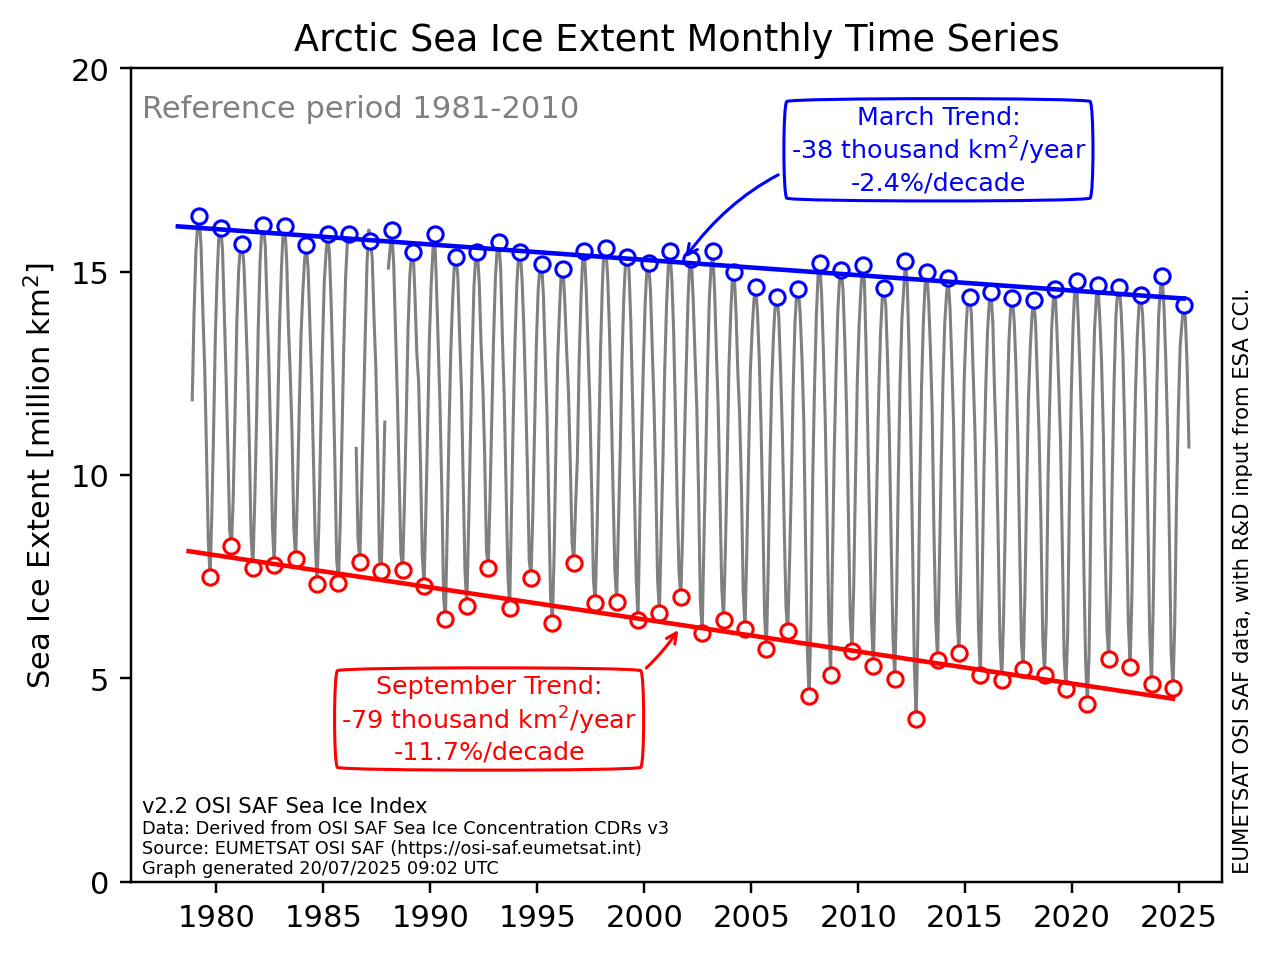
The graphics on the right show the monthly mean sea ice extent on the northern hemisphere.
The graphs illustrate a decreasing trend in sea ice extent since 1978, with large negative trends during summer and less negative trends during the winter.
Data
The sea ice extent data is composed by a Climate Data Record (CDR, 1979-2015), an Interim CDR (ICDR, since 2015 with 16 days delay) and a daily product to cover the period between the ICDR and today. Clic here for a detailed explanation.
The data are available at the Ocean and Sea Ice Satellite Application Facility (OSISAF)
You can read technical and validation reports of the products here.
|
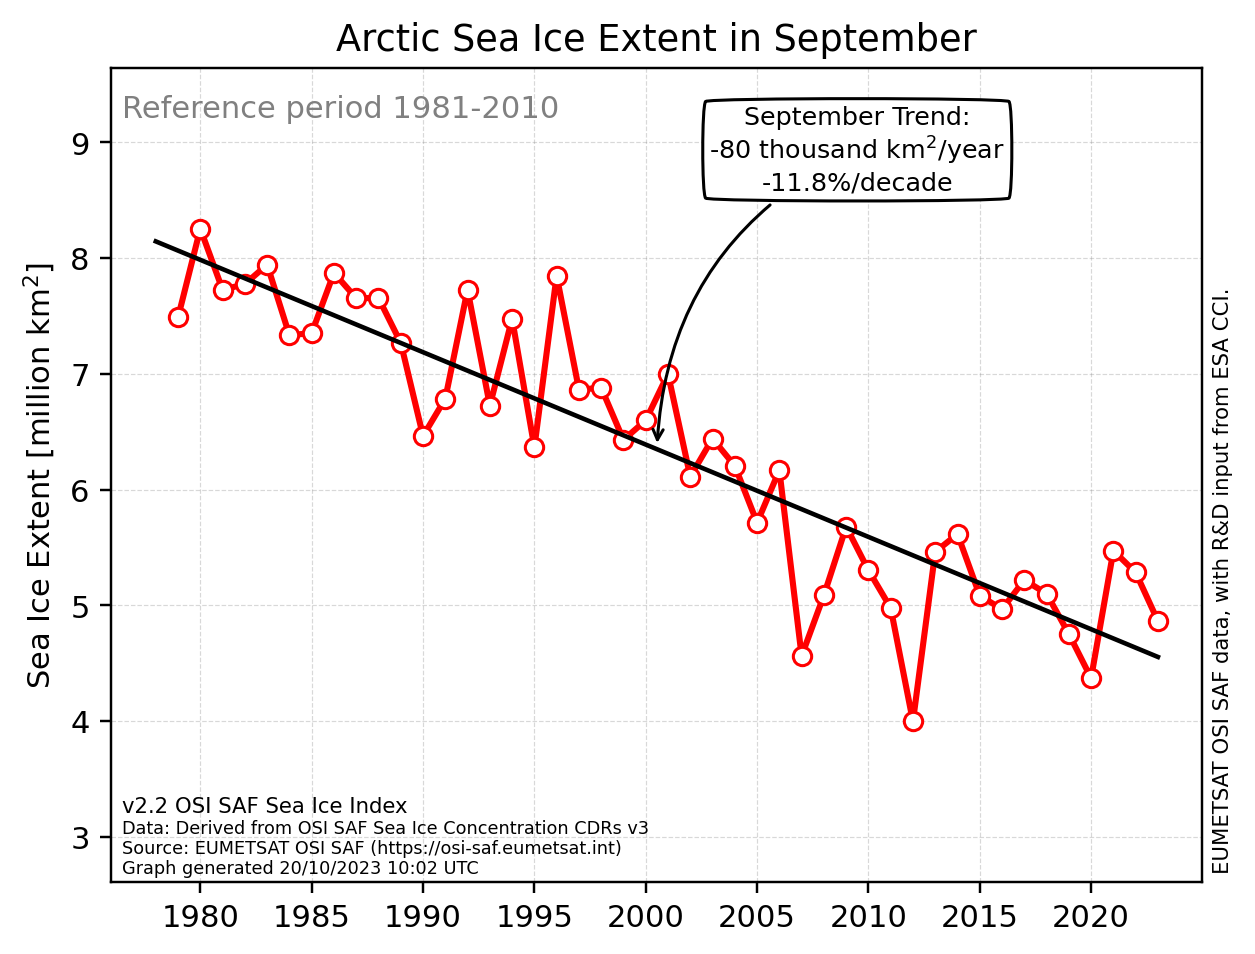
Mean monthly sea ice extent in millions of km2 for the northern hemisphere
since 1978. The September sea ice extent correspond to the annual minimum sea ice extent.
The black line indicate the trend in ice extent for the given month.
|
