The accident
The sugar freighter “ Tern” and the tanker “Baltic Carrier” collided
March 29th 2001 at 1:30 MESZ (Danish summer time) in the
Baltic Sea at the
position 54ş 43´ 36´´ N and 12ş 30´ 12 ´´E (in Kadetrenden - east of
Falster). The Baltic Carrier tanker was carrying 30.000 tonnes of Heavy Fuel
Oil 380. The fuel oil
immediately began to leak from a hole in the starboard side of the tanker
Baltic Carrier. The leaking tank contained approximately 2.700 tonnes of oil,
most of which was quickly lost to the environment. Due
to the rather rough sea condition (~2,5m waves) and the extent of the boat damages,
attempts to control the release of oil all failed.
Oil slick drift observation
The oil spill drifted from the accident location northwest
towards the Danish coastline, and reached the Grřnsund Strait 17:00 –
18:00 MESZ the same day. The oil continued to pollute the coasts of Bogř,
Nordfalster and the souternh parts of Mřn. The total affected coastline has
been estimated to about 30 – 50 km.
Model setup specifications
In the model the oil release was specified by an instantaneous release of 1000
tons oil and the applied oil type was heavy Intermediate Fuel Oil, IFO
450, which is the oil type, most alike IFO 380, which is available in the
model and contain a high fraction of residual fuels.
3D model result
The model predicted
oil drift and spreading through the Grřnsund Strait between Falster and
Mřn and an oil pollution of the south coast of Mřn, at 17:00 MESZ in
agreement with observations. The model predicted oil to drift through the
strait between Bogř and Mřn. In reality a dam is built between Bogř and
Mřn, which forces the oil to drift past instead of through.
Figure 1 shows the model
predictions results for the oil weathering processes changes as a function
of time. 16 hours after the oil spill the model
predicted 9.6% oil evaporation and 1.5% oil dispersed to deeper water
layers – i.e. 88.6% oil was left at sea surface. In agreement with the
observations only a small percentage was evaporated and removed naturally.
The main part of the spilled oil polluted the coasts of Denmark – in
agreement with observations.
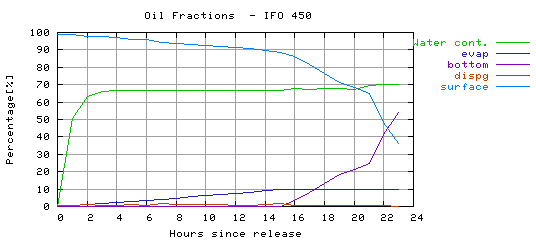
Figure 1. Oil fractions for "IFO 450"
oil during the simulation.
Figure 2-5 below, shows the
simulation results of the Baltic Carrier oil spill.
The blue star indicates the oil spill release position. Red colour
indicates oil at the surface, light blue colour dispersed oil and dark
blue colour oil deposited at either sea bottom or coastlines.
Simulation series
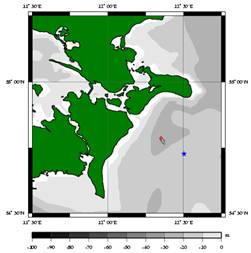
Figure 2. Simulation time: 29.03.01 13:00 MESZ. (12 hrs after the oil spill).
The oil spill drifted towards the Grřnsund Strait of Denmark. The oil
spill is both drifting at the sea surface and in the deeper water
layers. |
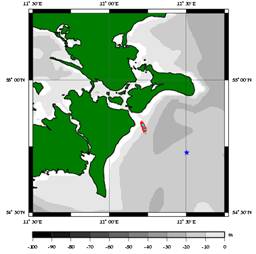
Figure 3. Simulation time: 29.03.01 17:00 MESZ. (16 hrs after the oil
spill). The oil slick has reached the mouth of Grřnsund Strait. |
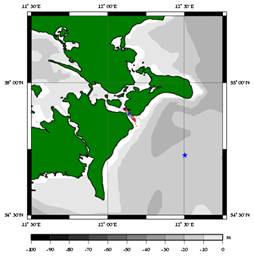
Figure 4. Simulation time: 29.03.01 19:00 MESZ. (18 hrs after the oil
spill). The oil has polluted the south point of Mřn. |
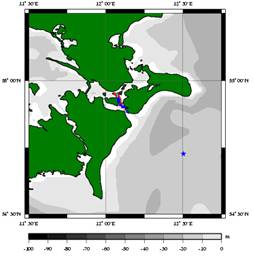
Figure 5. Simulation time: 29.03.01 21:00 MESZ. (20 hrs after the oil
spill). The oil spill drifted through the strait between Bogř and Mřn
– which is a result of the missing constructed dam in the model
topography. As indicated by the dark blue colour oil has stranded both
on the sea bottom and coastlines |
2D model result
Using the MIKE 21-SA 2D oil drift model the oil slick was predicted to
drift northwest with a southern deflection – causing the main oil spill to
strand on the coastline of Hesnćs (Falster) approximately 3 km south of
the mouth of Grřnsund Strait – in disagreement with the observations.
Comparison of 3D model and 2D model
Figure 6 shows the simulation by
the 3D Oil Drift and Fate Model and MIKE 21-SA, respectively. The MIKE
21-SA drift simulation (blue line) deviates from the observations of the
oil drift and the oil drift simulated by 3D Drift model (red line). The
most likely explanation to this deviation between the two models is the
differences in current fields of the models. The 3D drift model applies a
3D current field, while the 2D drift model applies a 2D depth-integrated
current field.
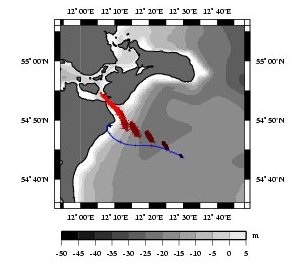
Figure 6. Simulated oil drift
by the “3D drift and fate model” (red signature) and “MIKE21-SA” (blue
line), respectively. Result from the 3D drift and fate model is plotted
for each 3-hour and oil drift result by MIKE 21-SA is plotted as a mean
track each hour.
Conclusion
In the Baltic Carrier case, the
3D oil drift and
fate model predicted oil drift and spreading through the Grřnsund
Strait and oil pollution of the south coast of Mřn – both in agreement
with observations. The constructed dam between Bogř and Mřn is not
implemented in the model topography, which caused the model to predict oil
drift north of the Bogř Island and through the strait between Bogř and Mřn.
In reality the oil drift was west of the island of Bogř.
Reference
Christiansen, B. M.,
2003: 3D Oil Drift and Fate Forecast at DMI. Technical
Report No. 03-36. Danish Meteorological Institute, Denmark.
