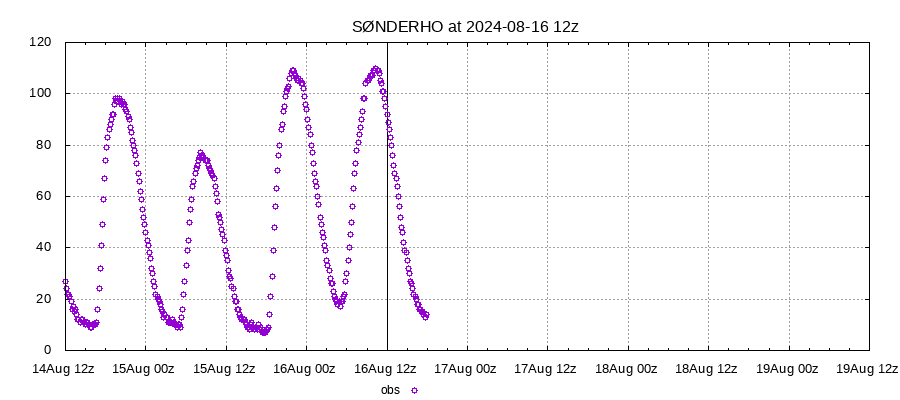
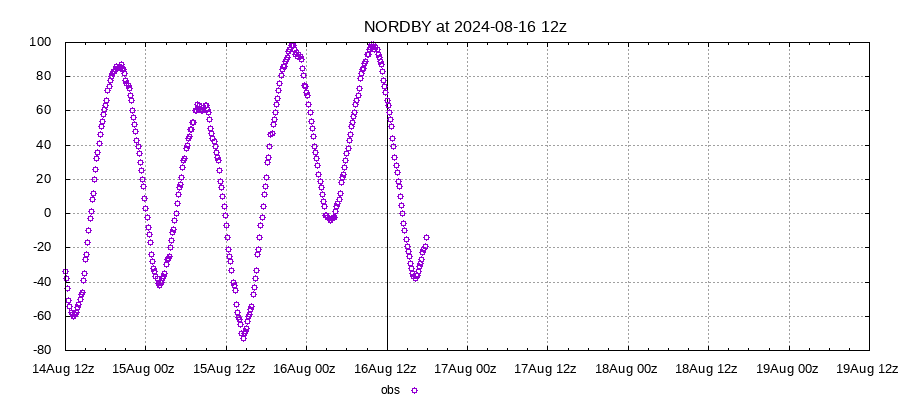
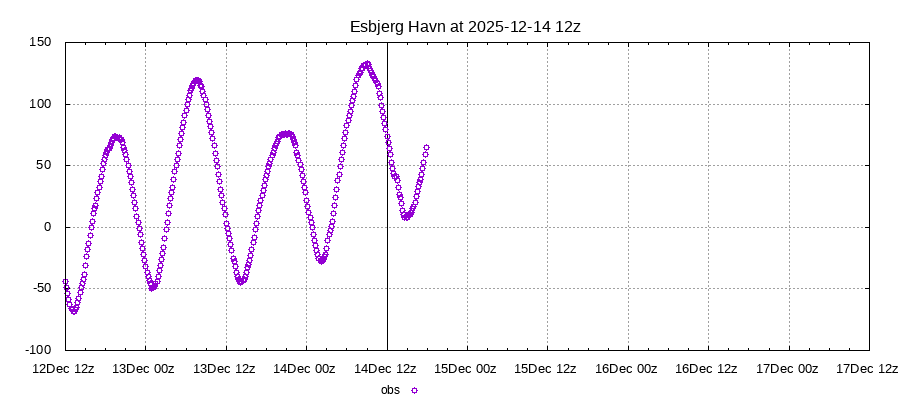
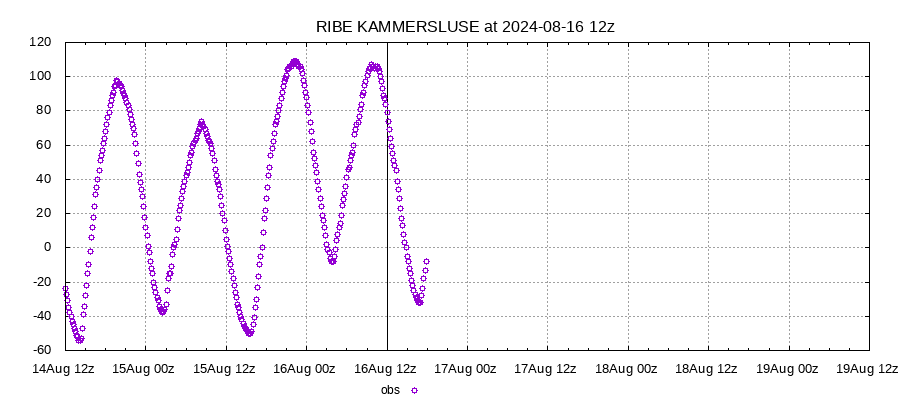
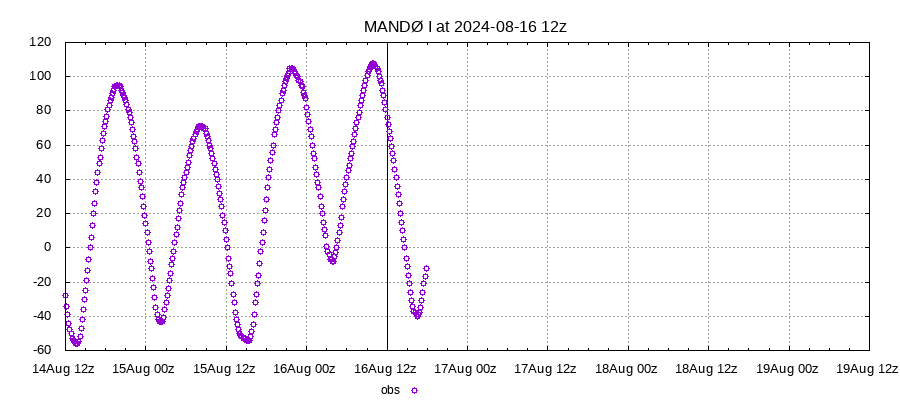
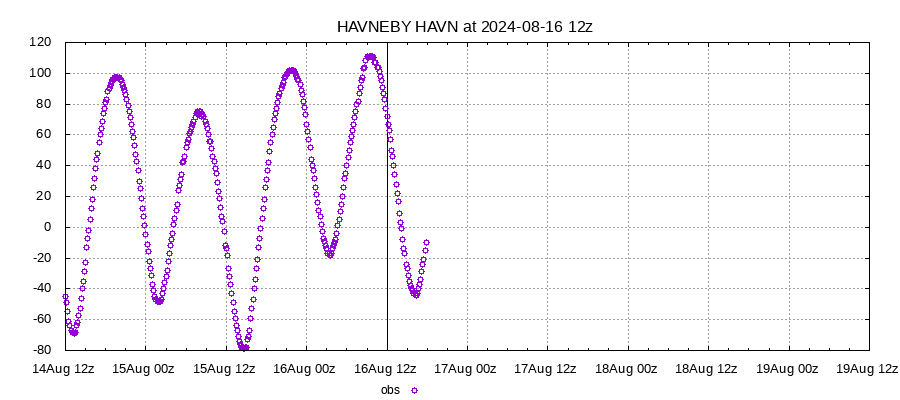
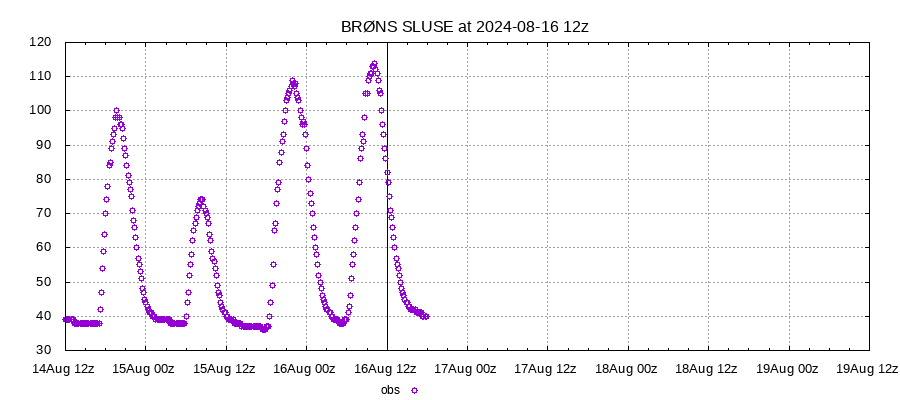
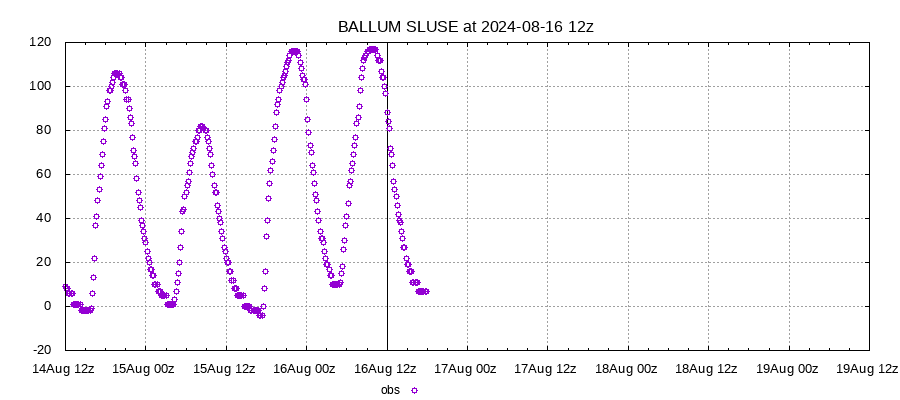
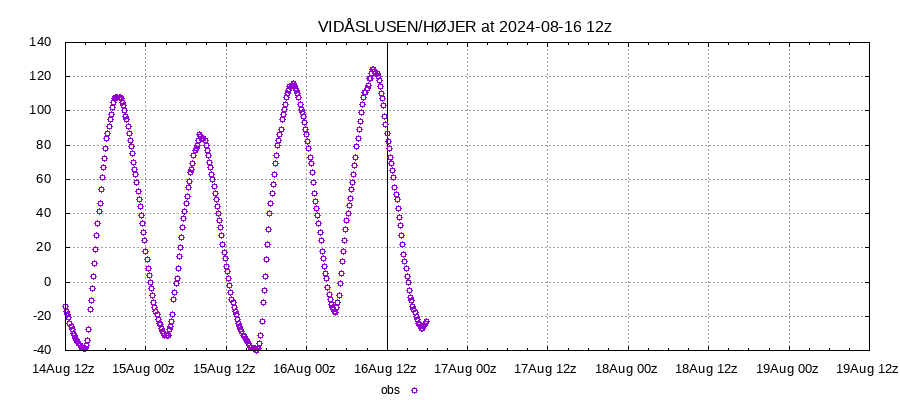
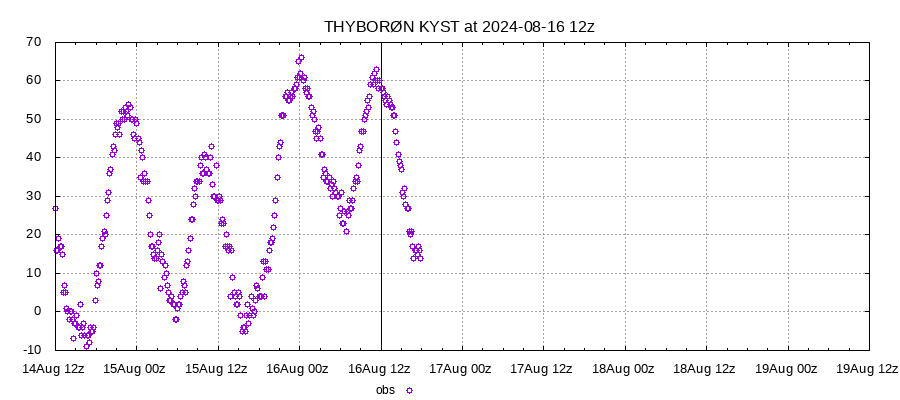
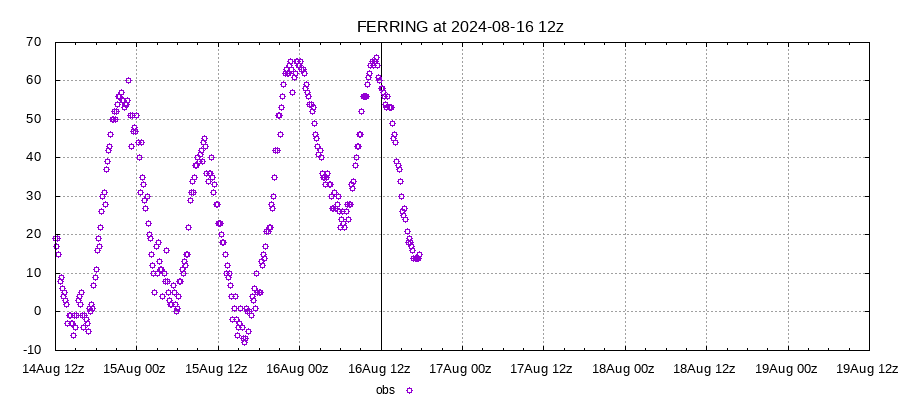
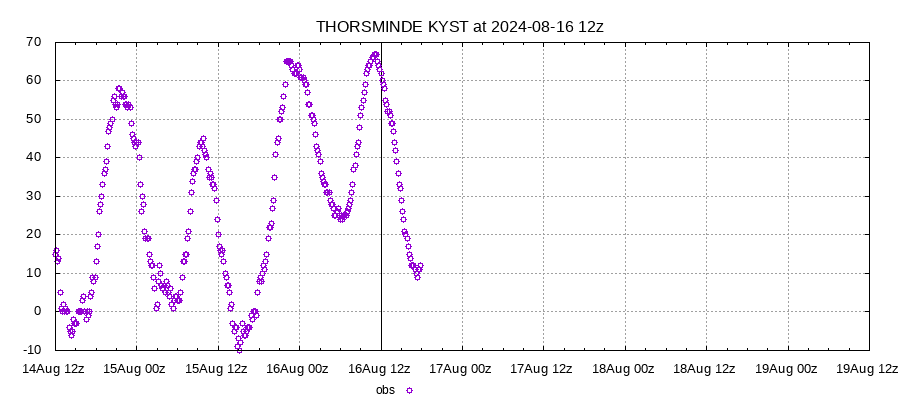
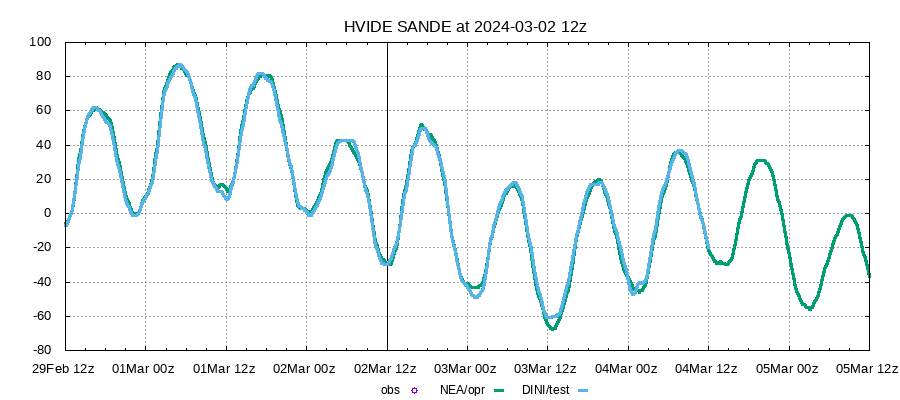
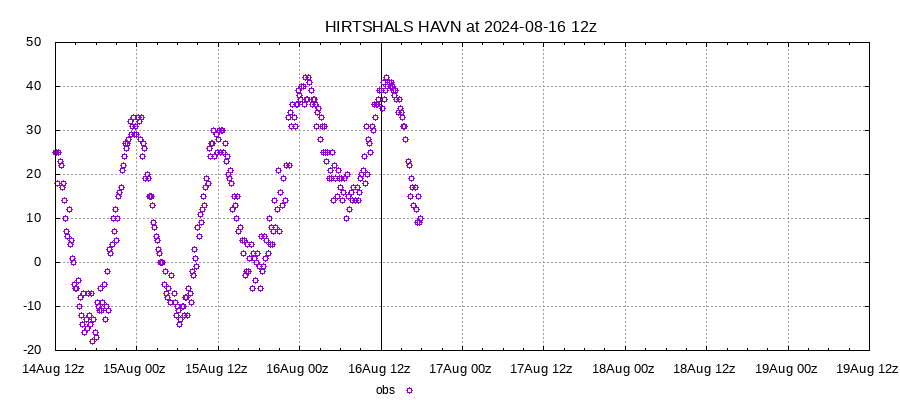
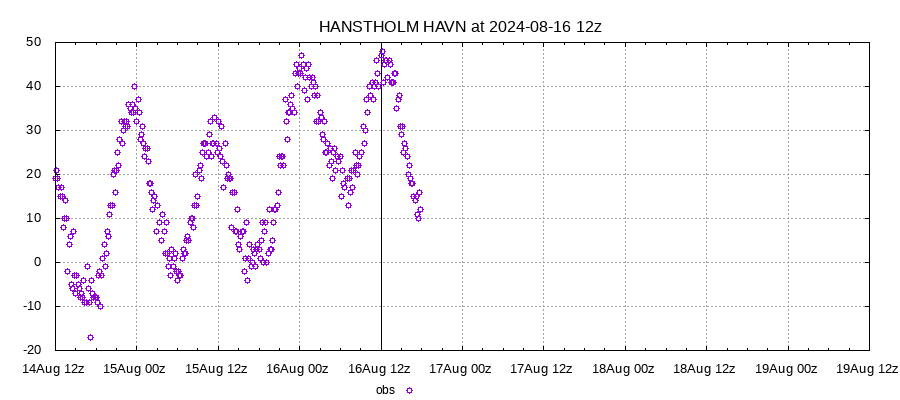
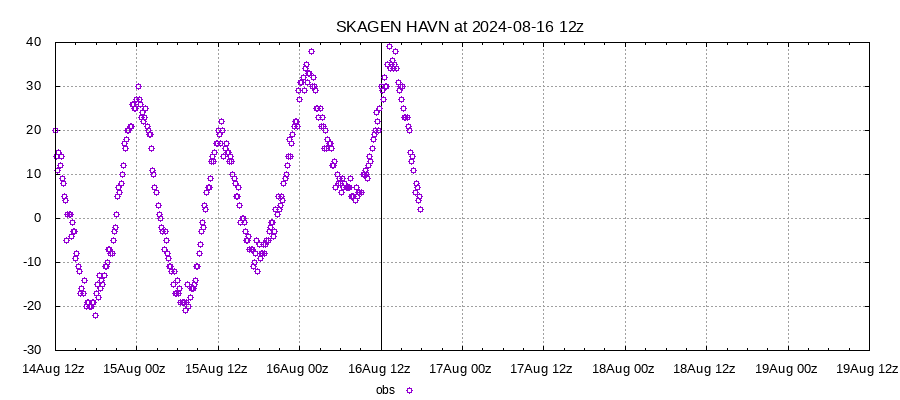
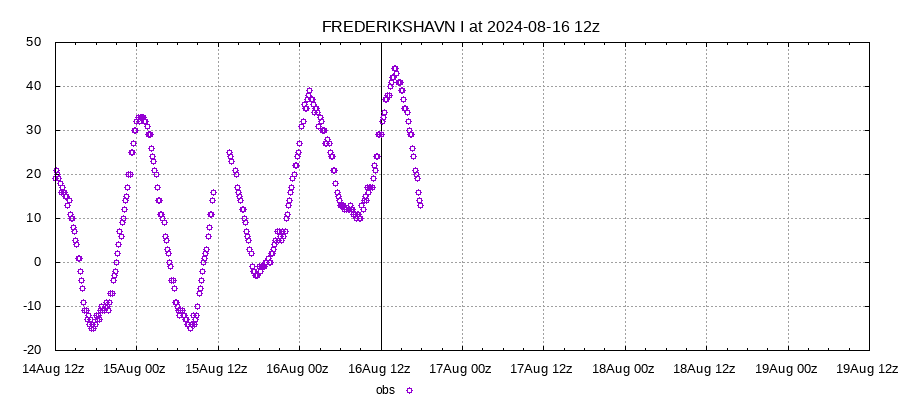
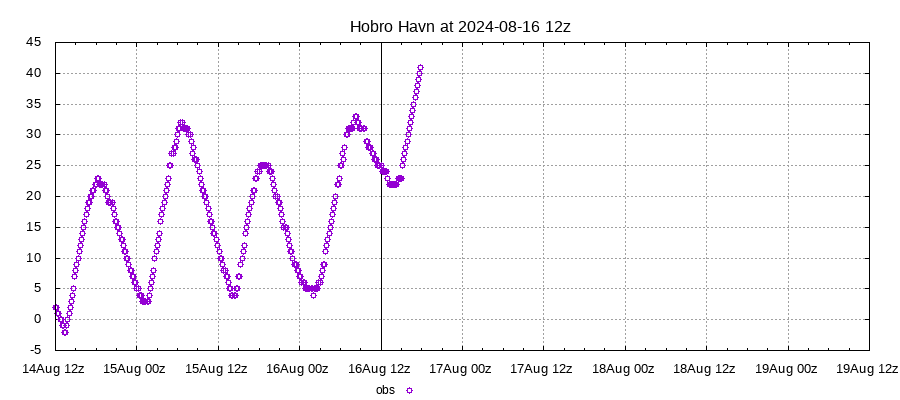
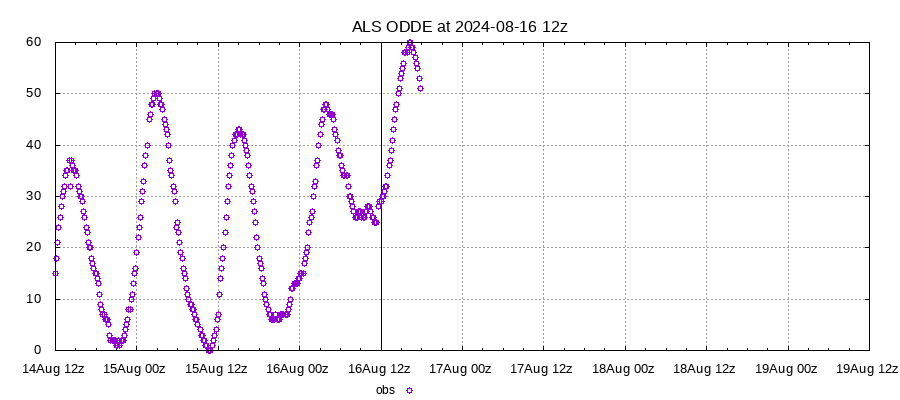
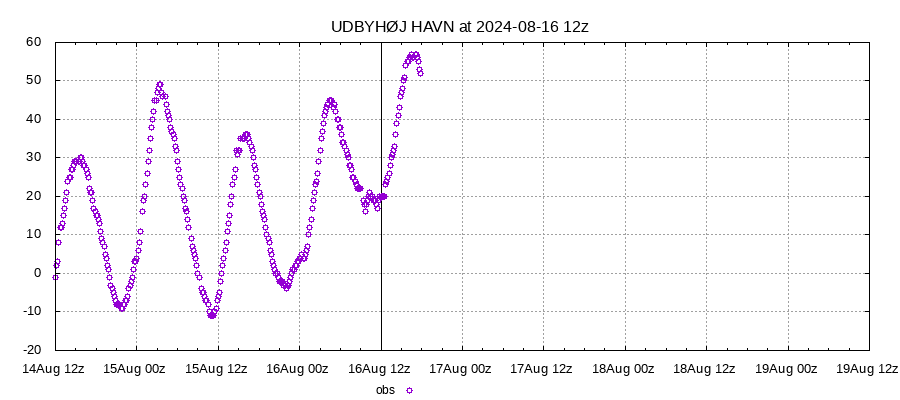
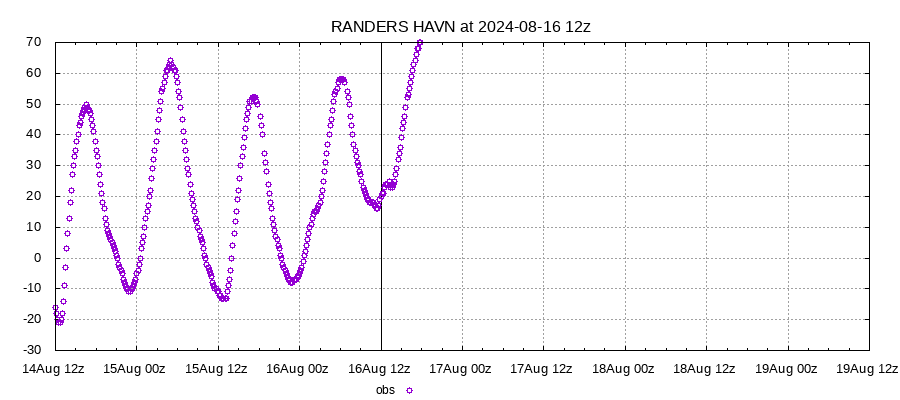
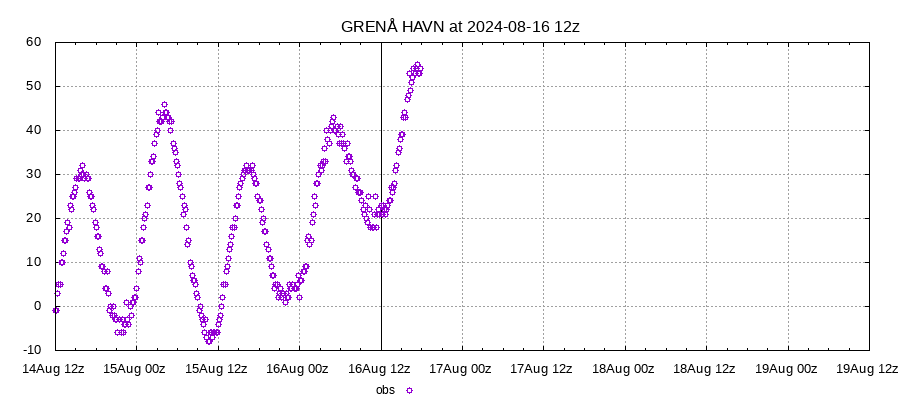
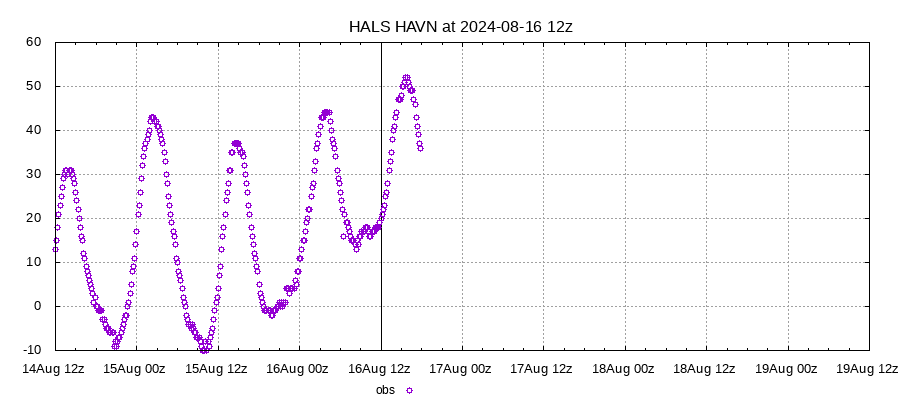
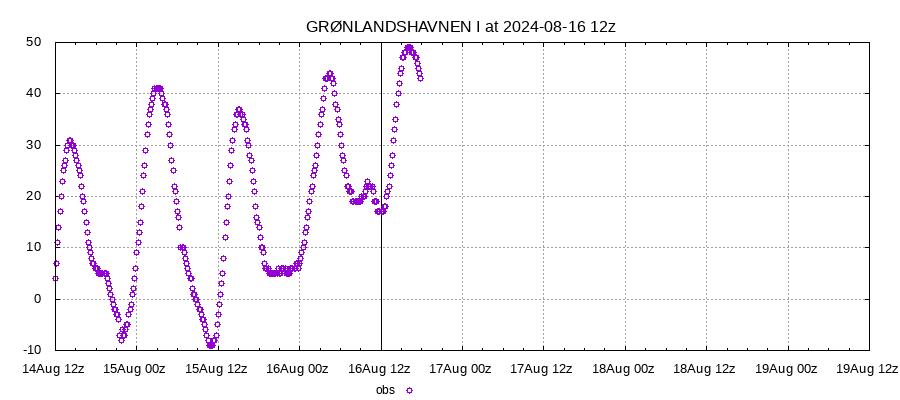
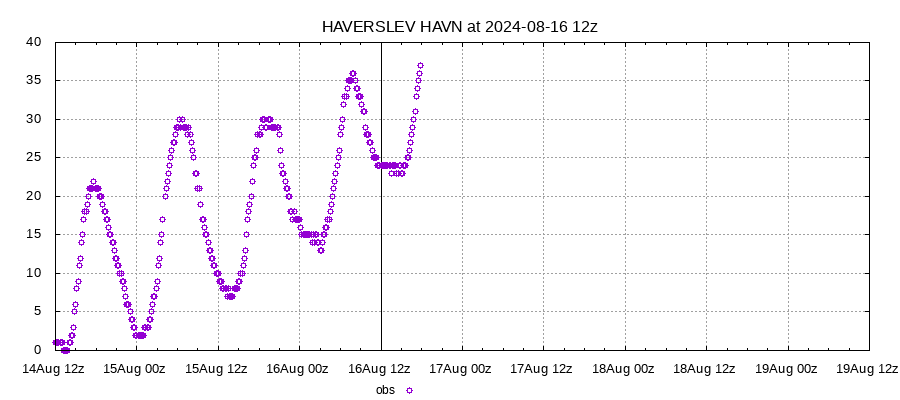
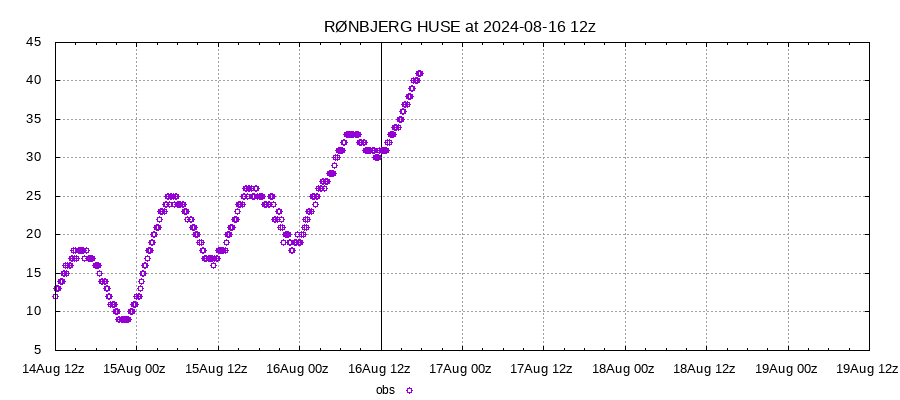
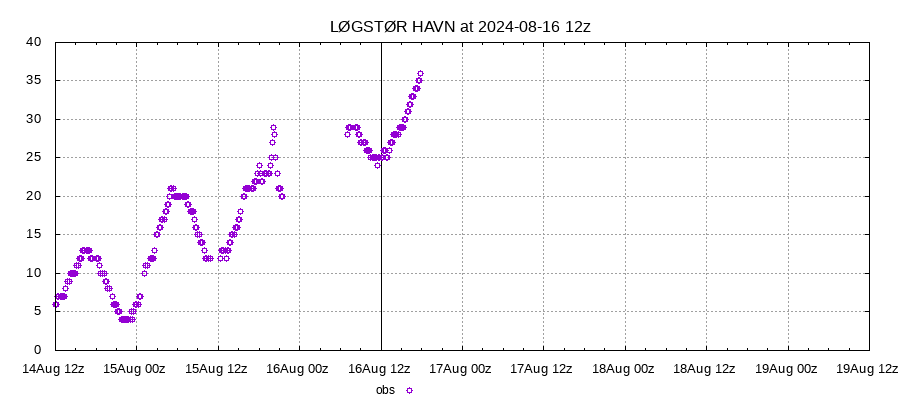
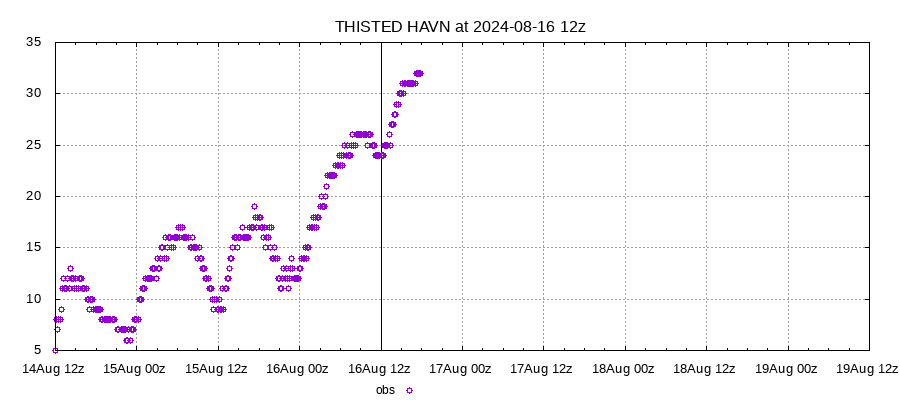
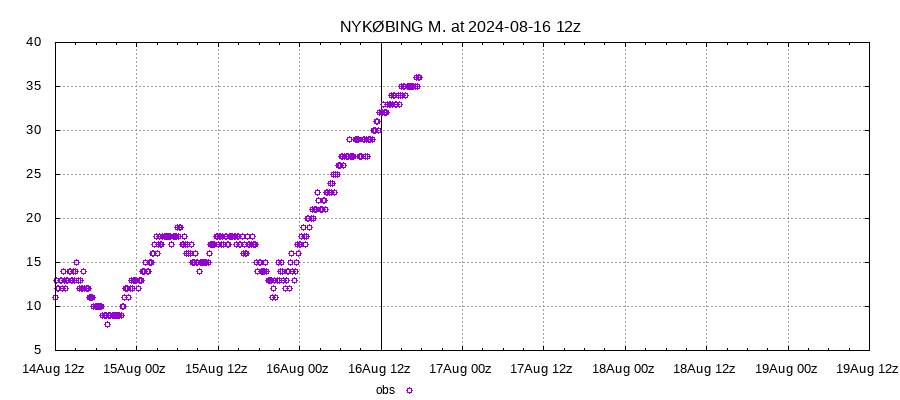
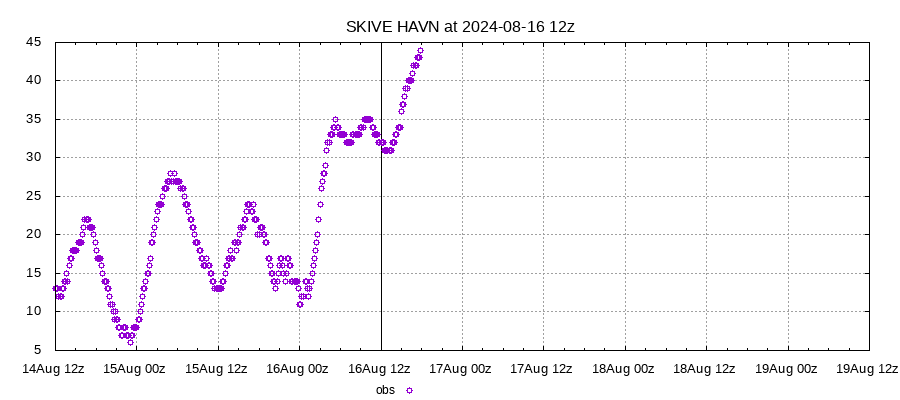
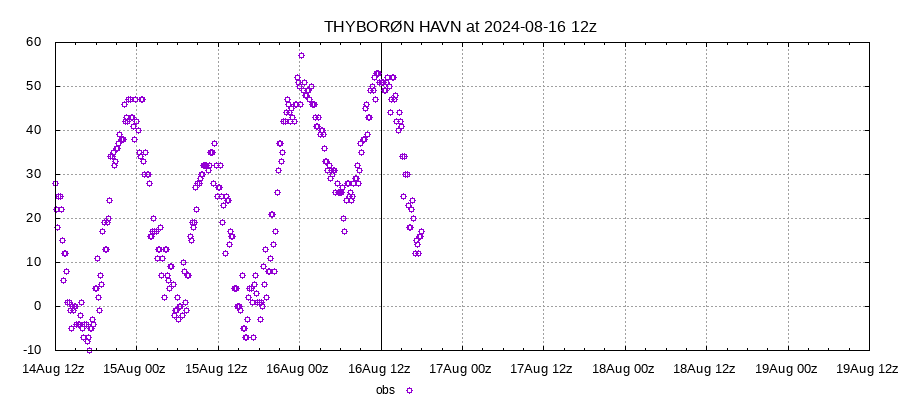
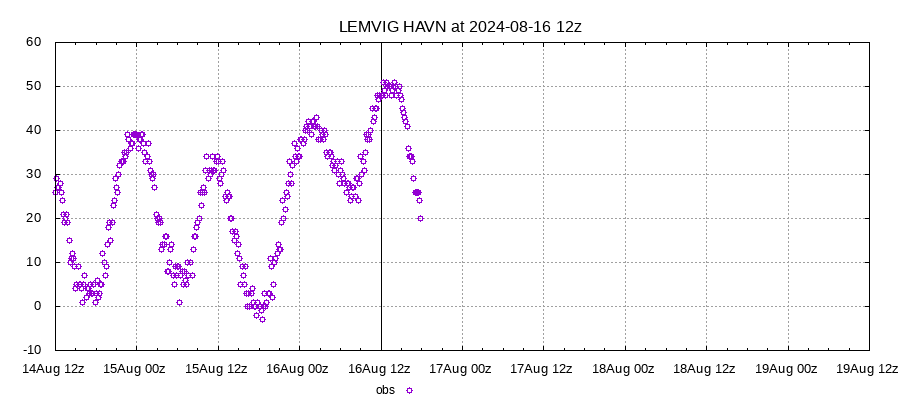
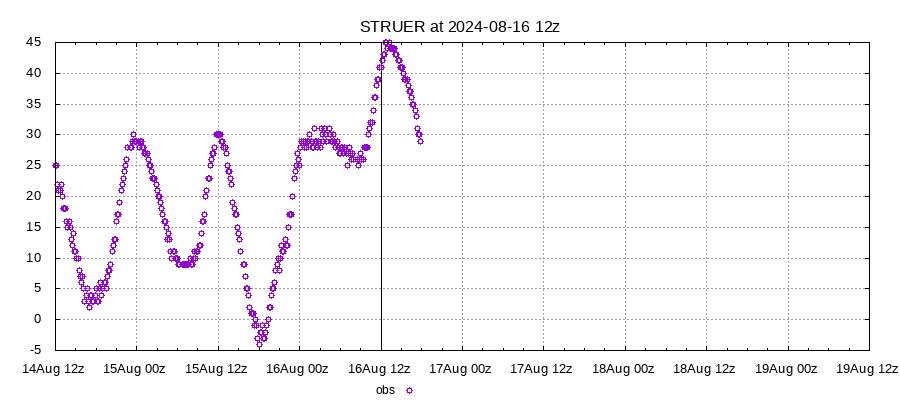
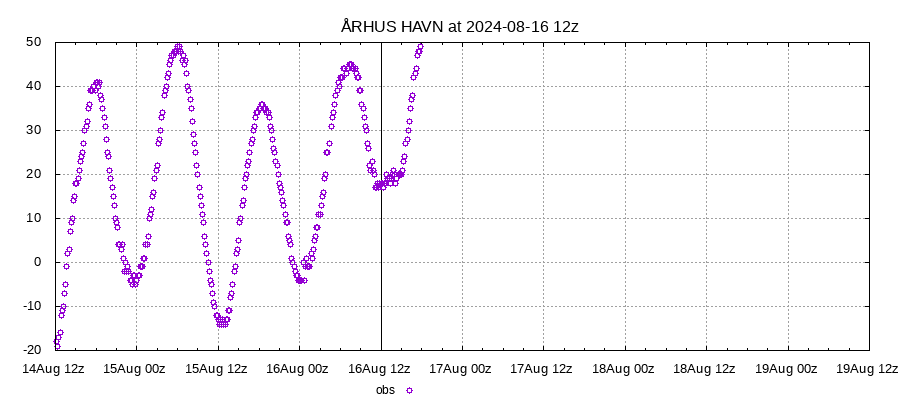
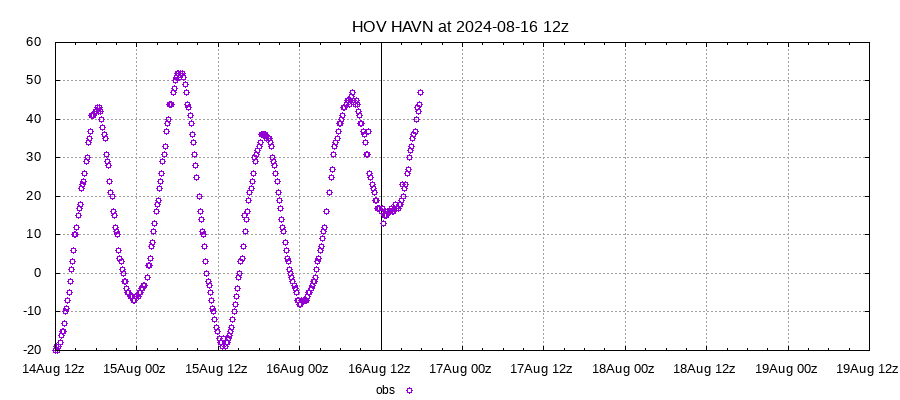
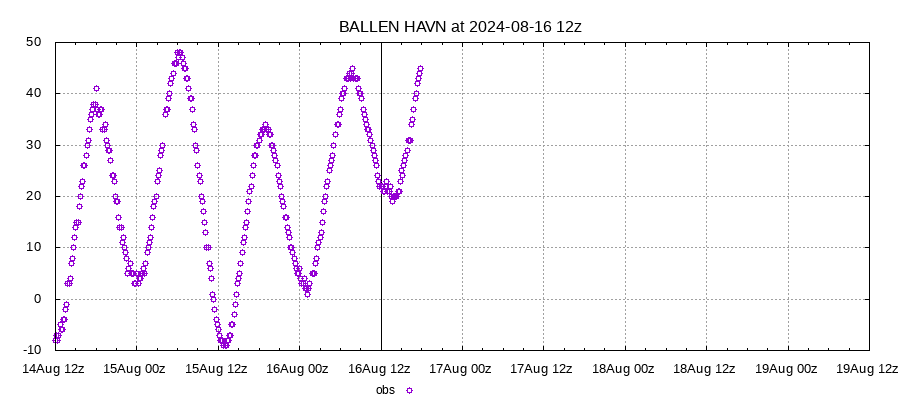
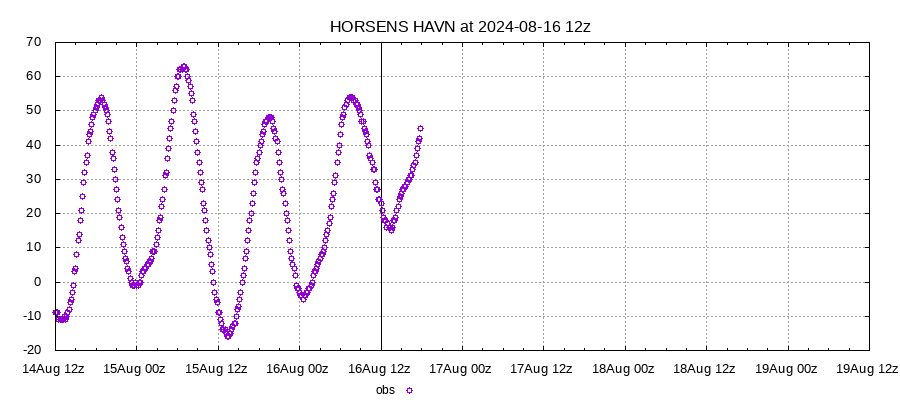
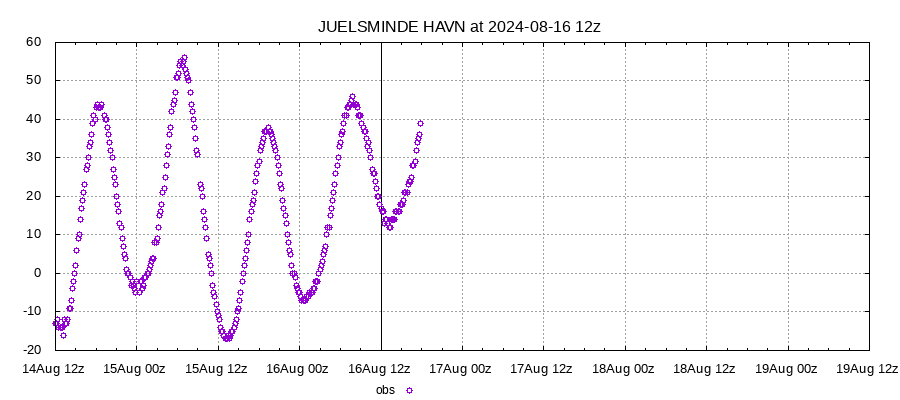
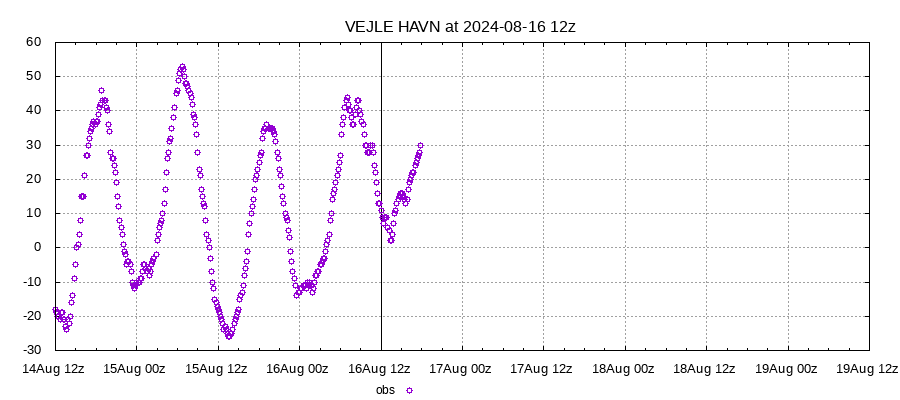
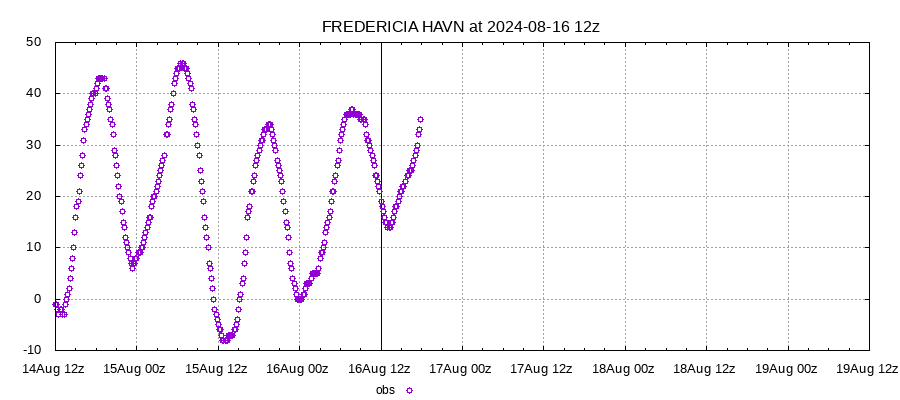
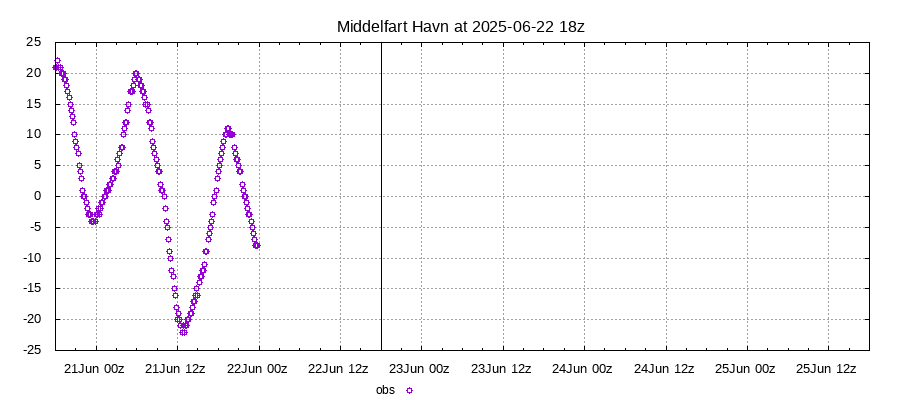
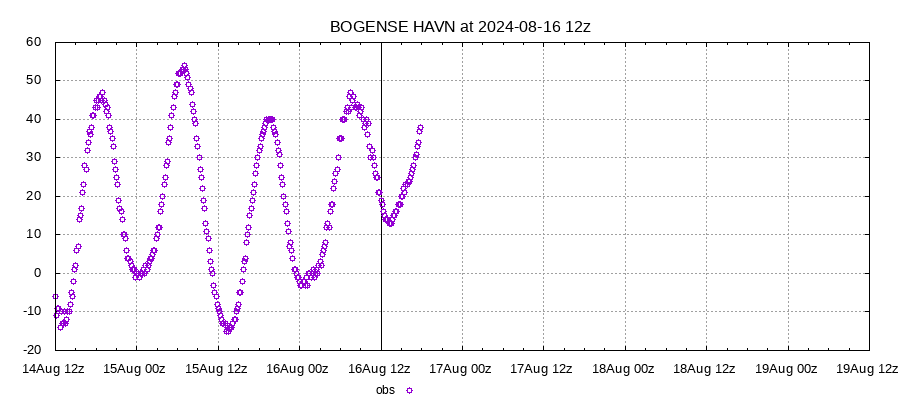
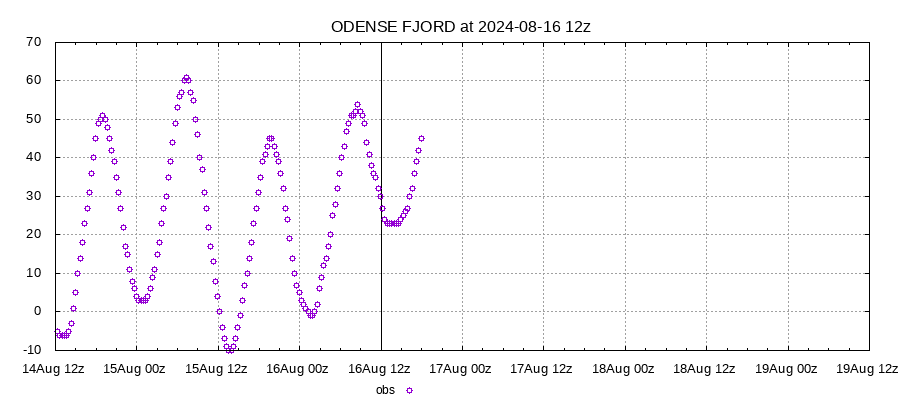
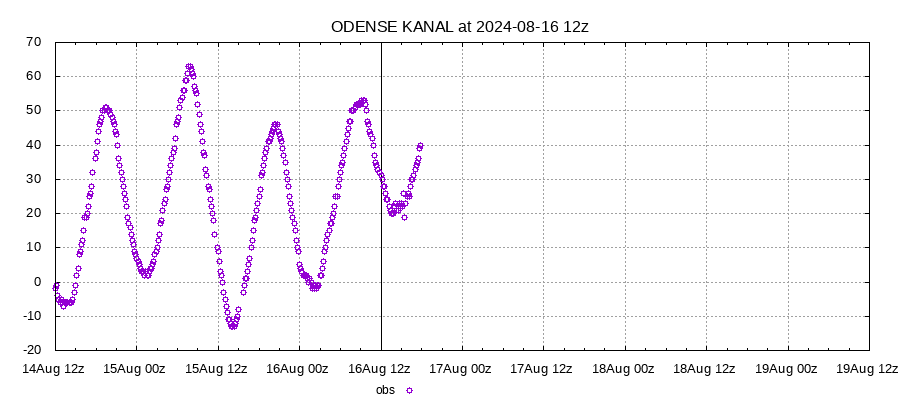
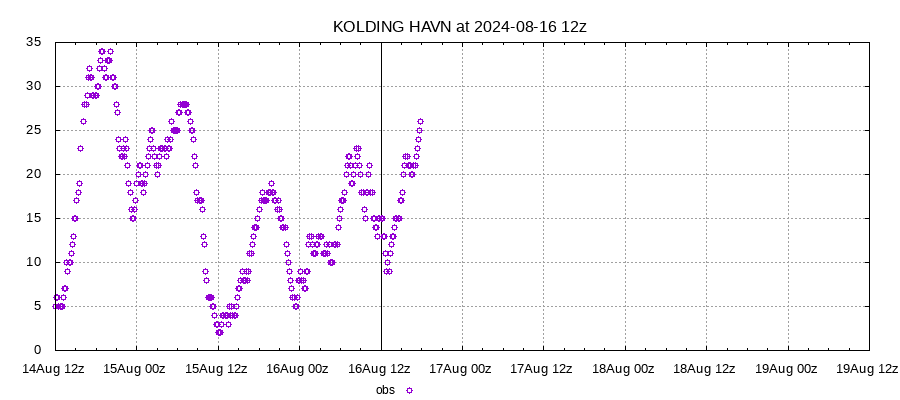
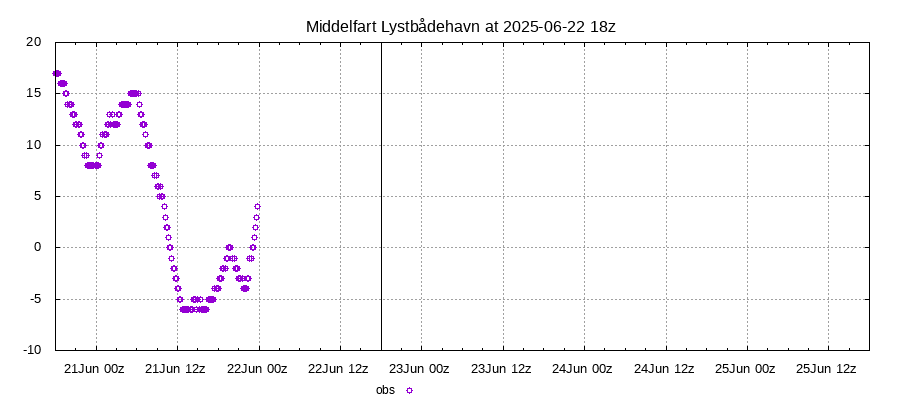
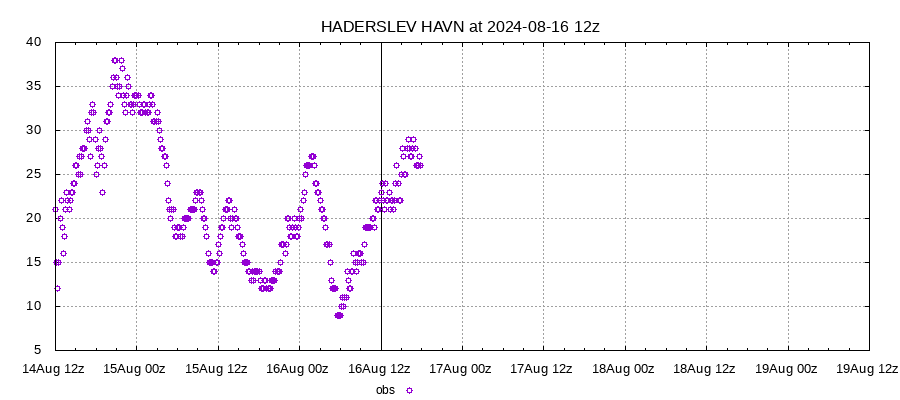
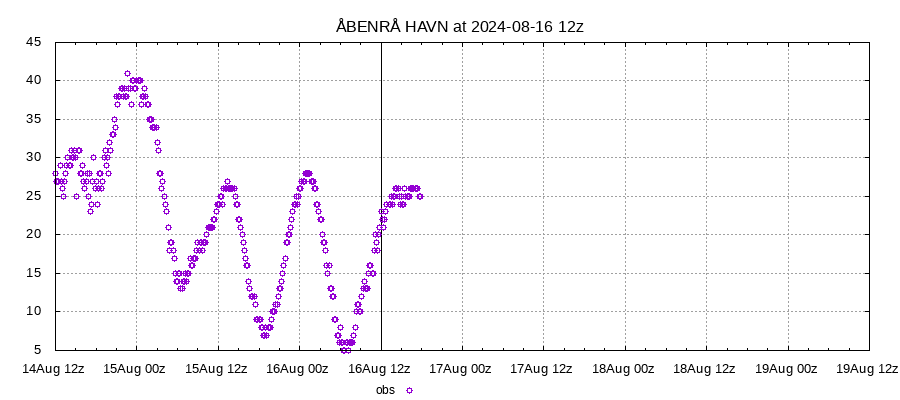
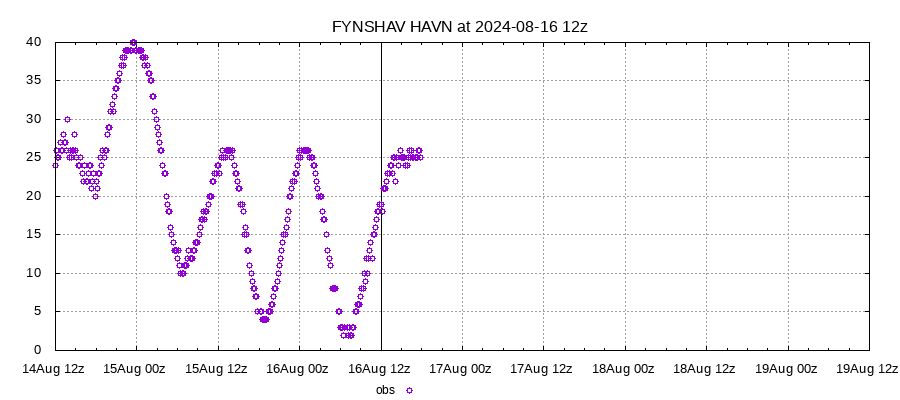
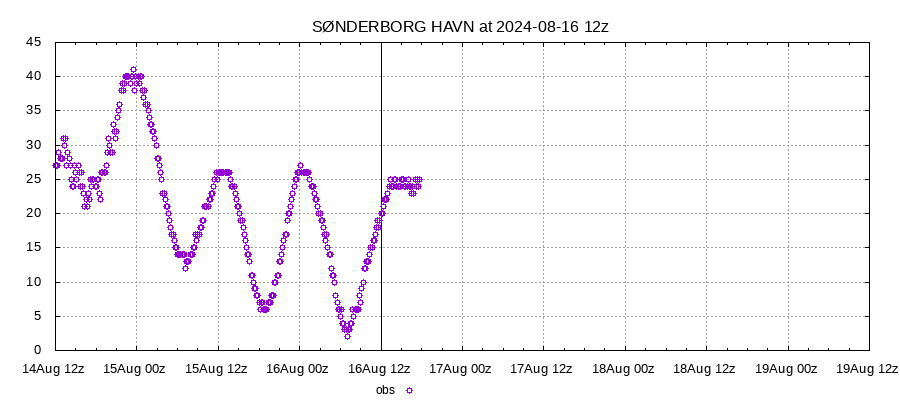
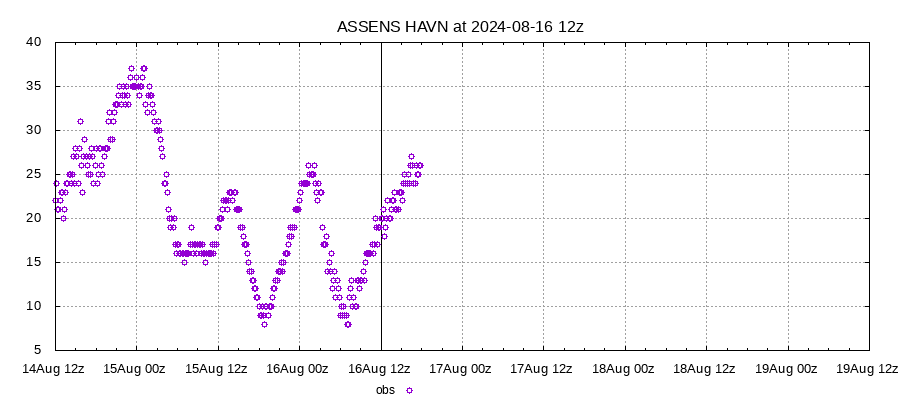
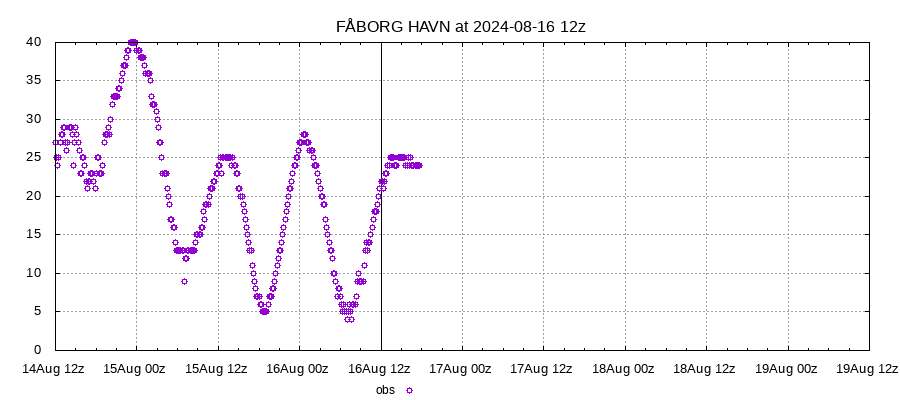
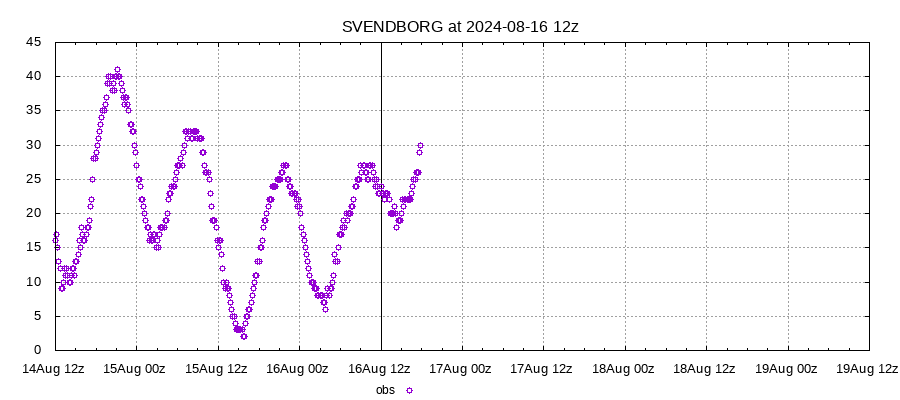
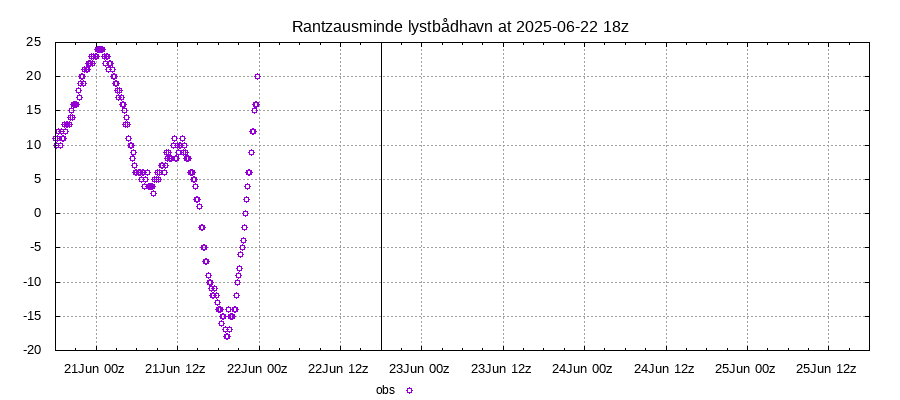
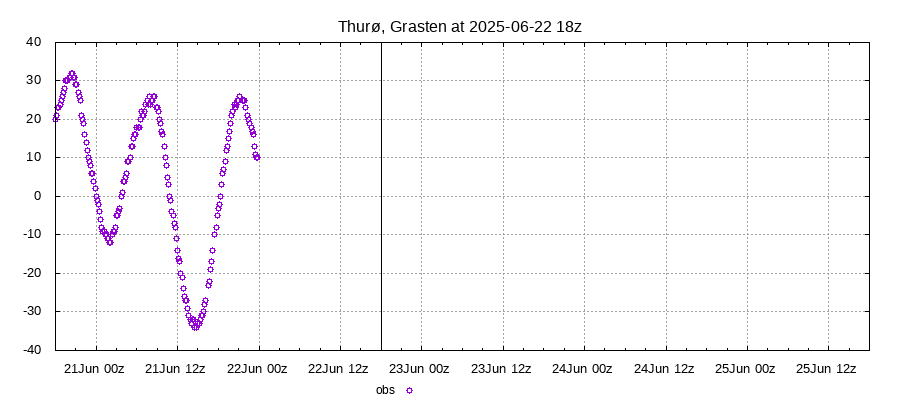
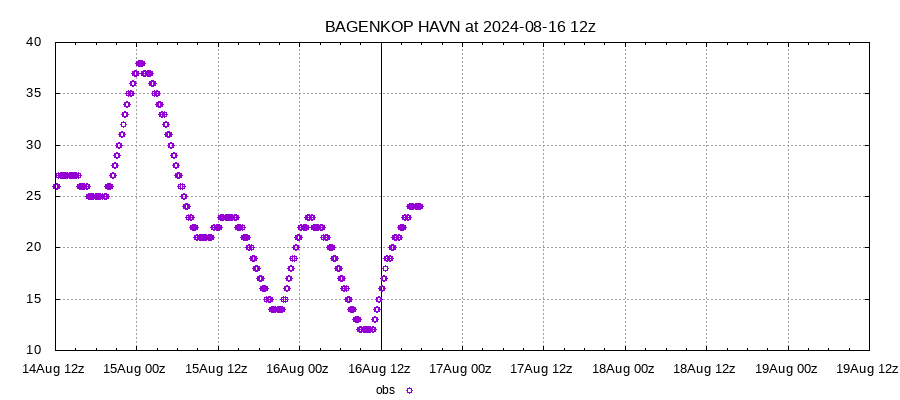
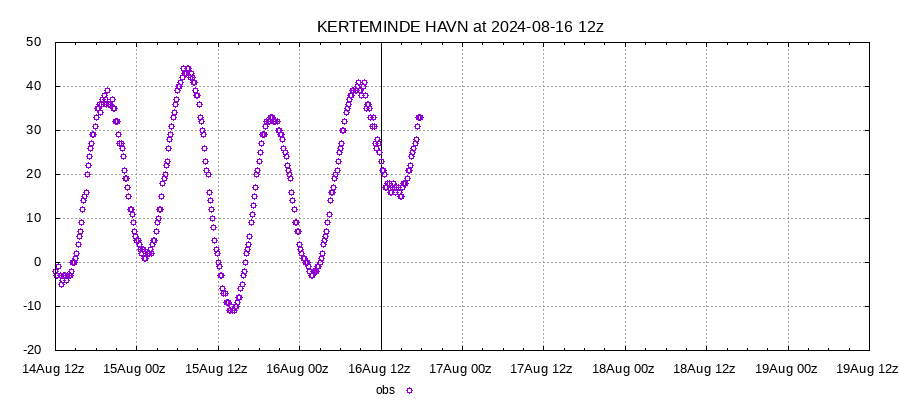
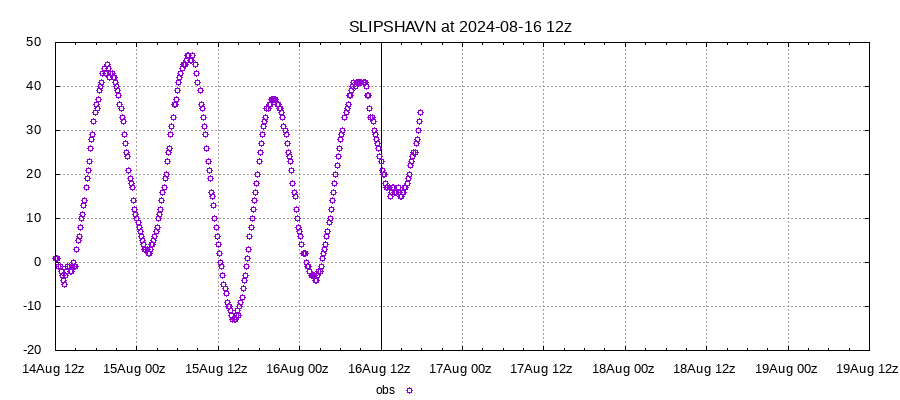
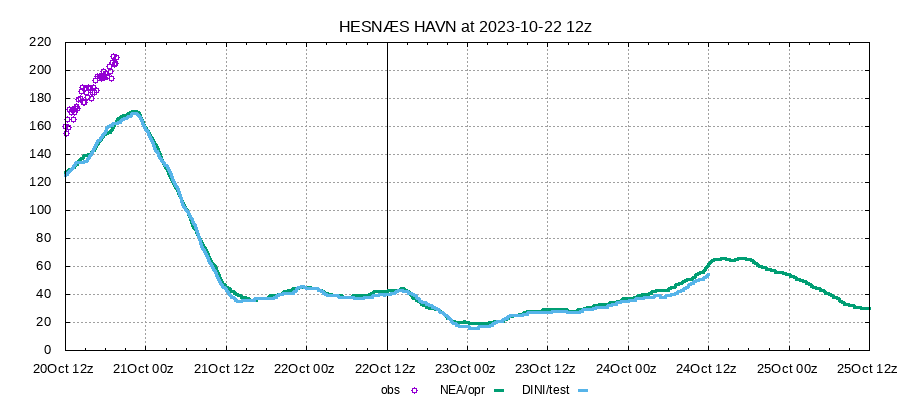
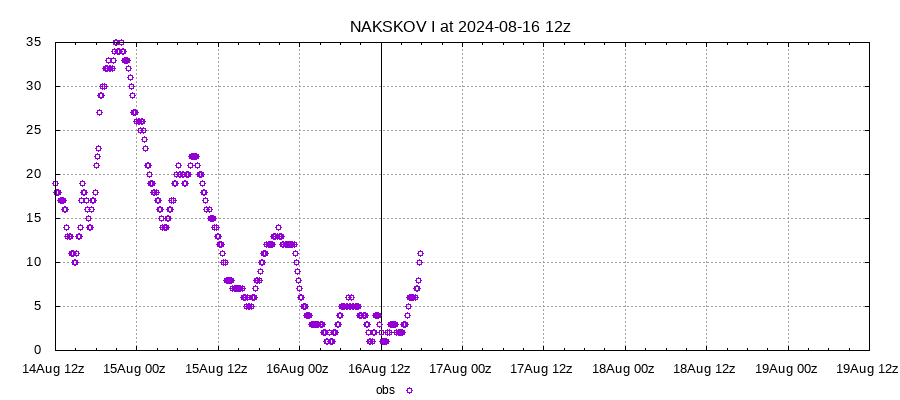
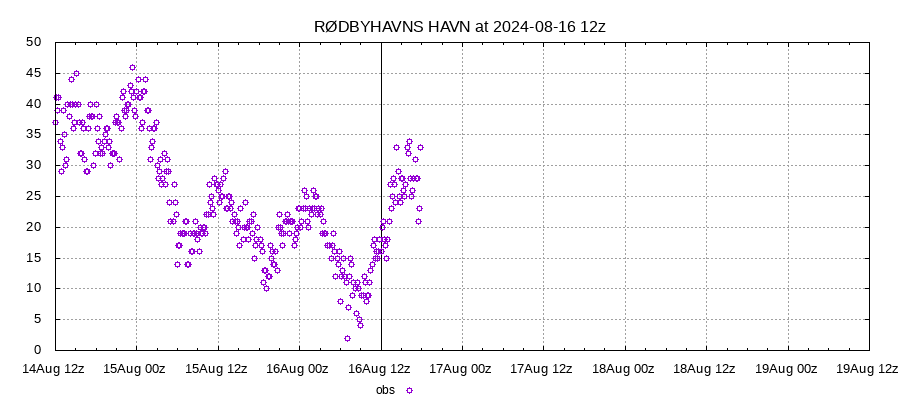
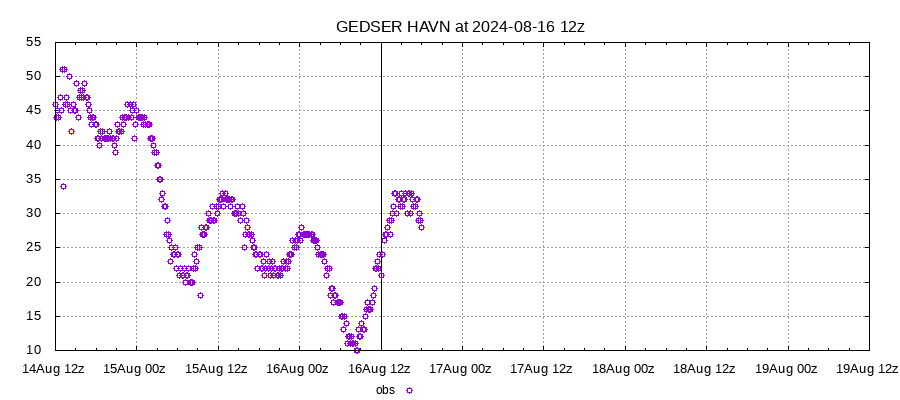
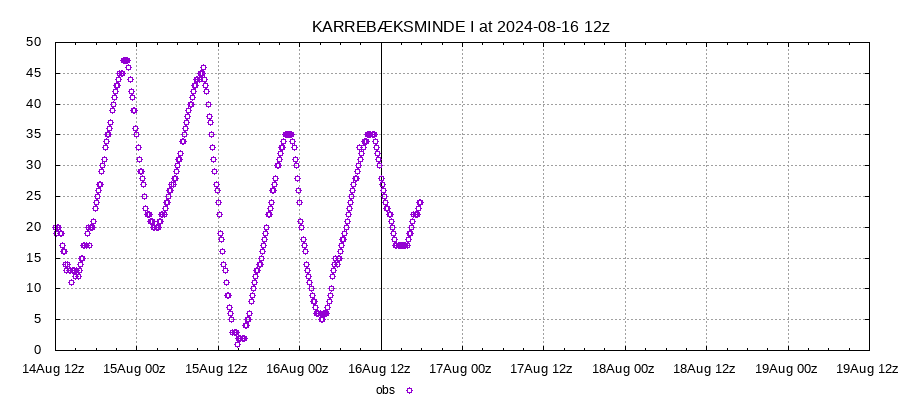
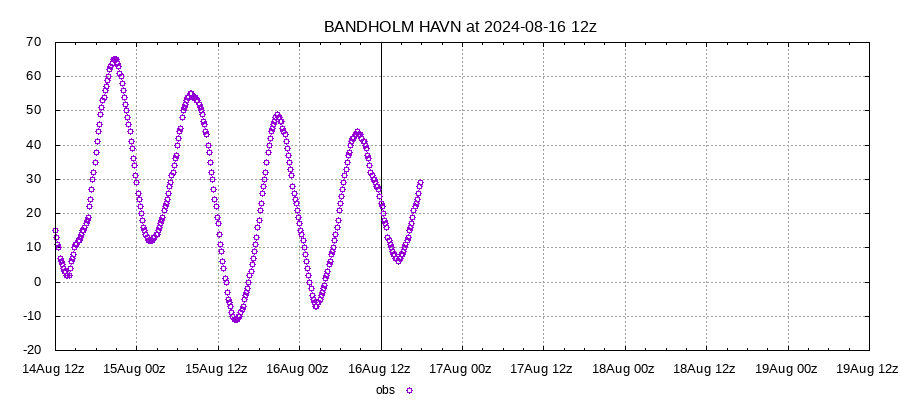
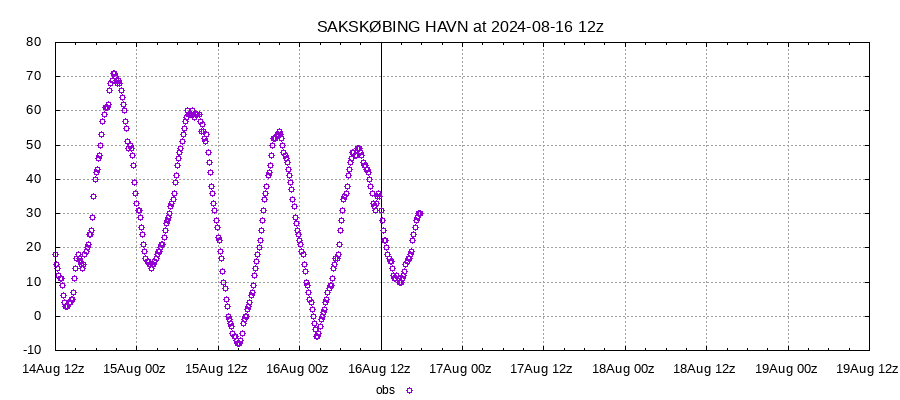
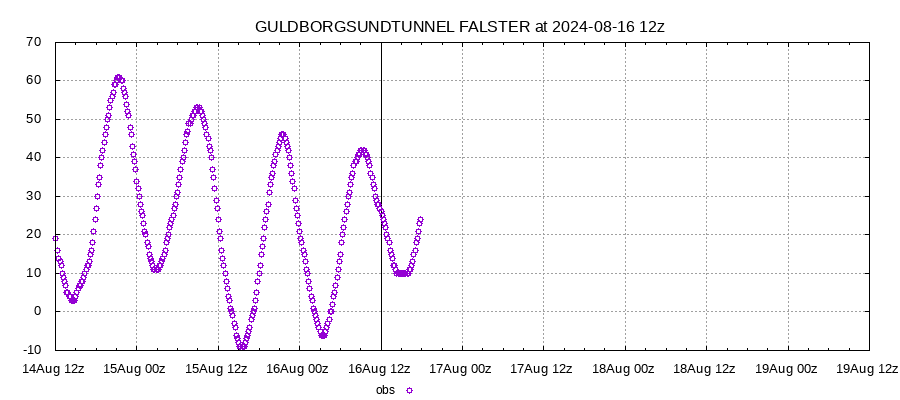
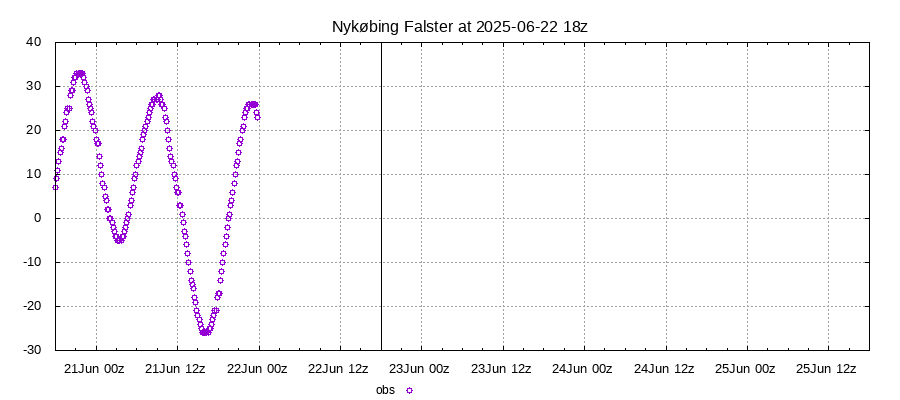
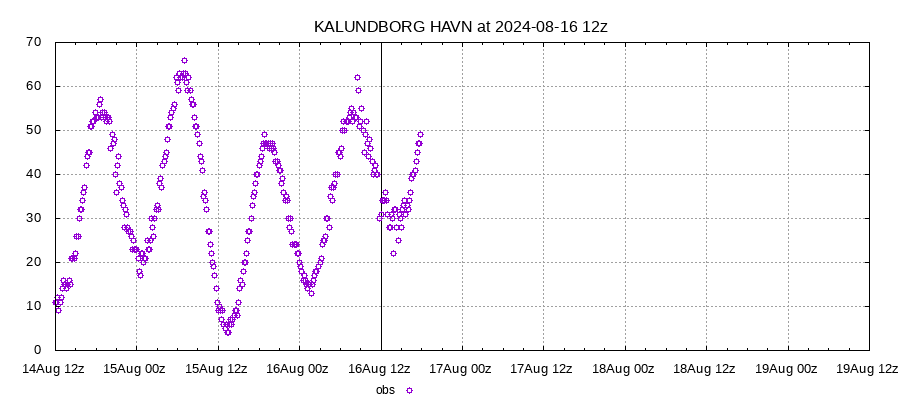
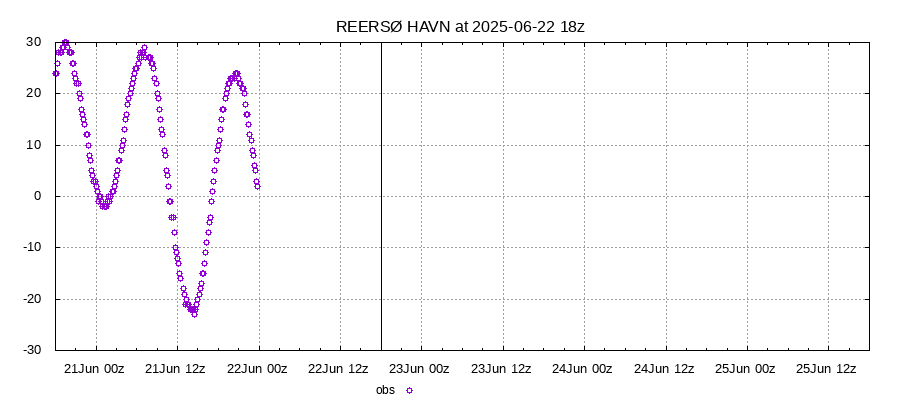
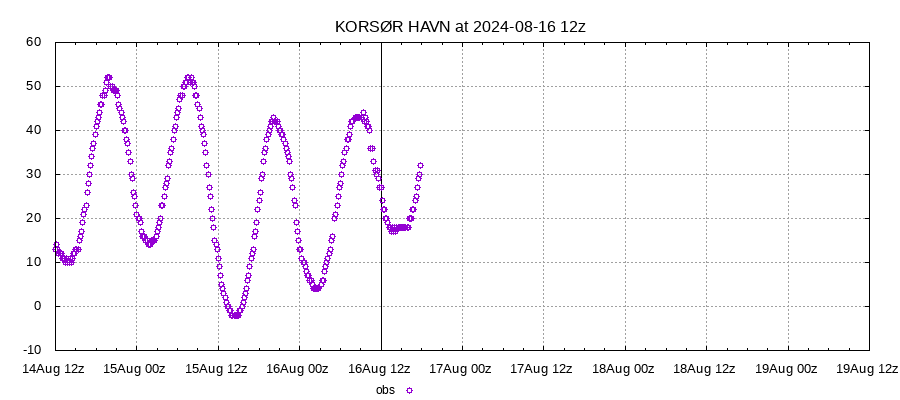
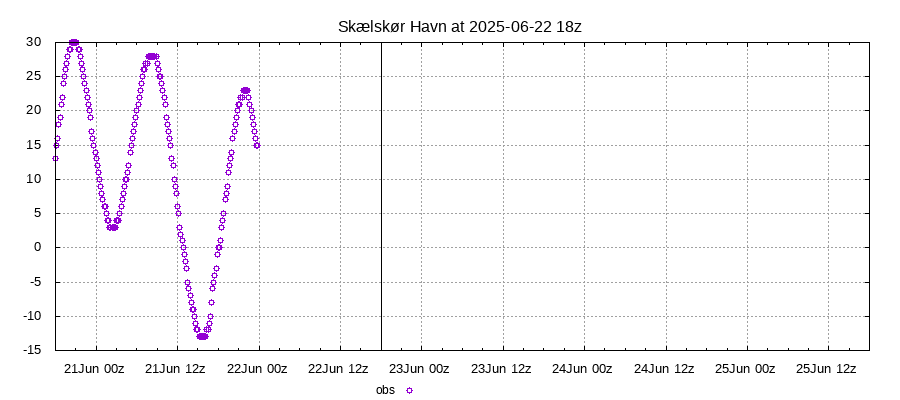
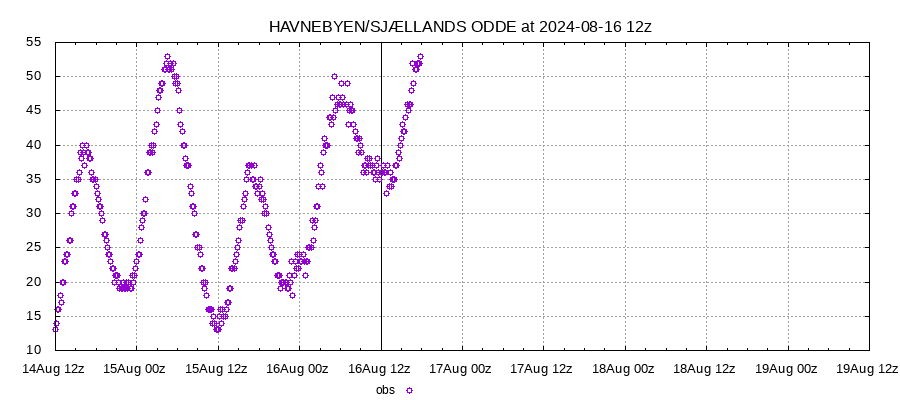
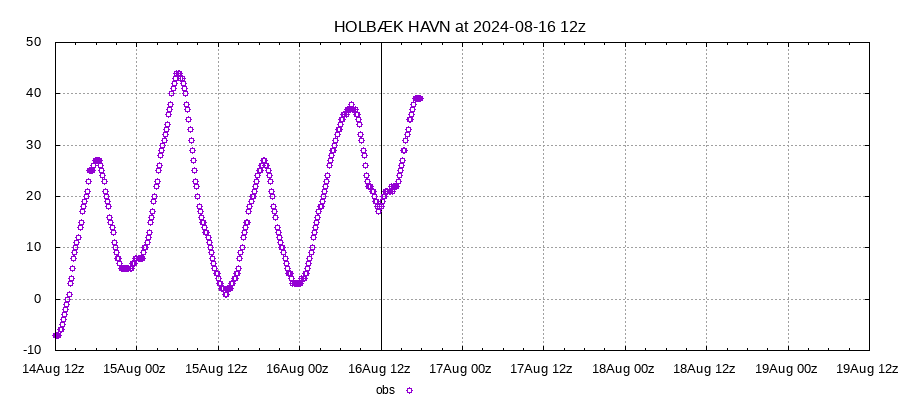
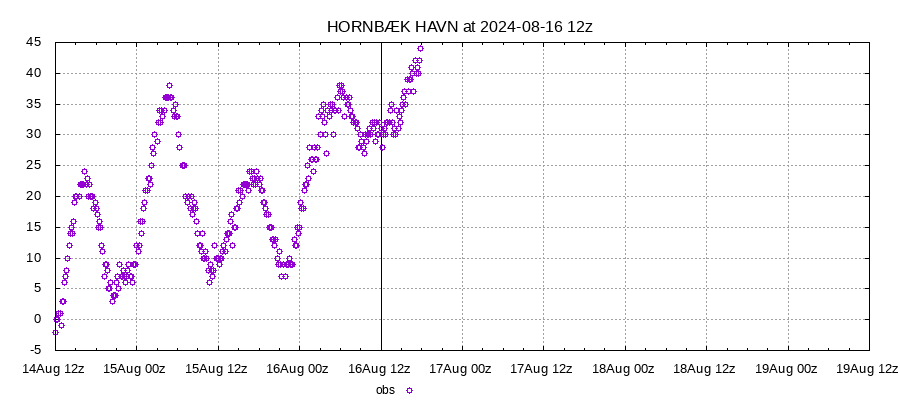
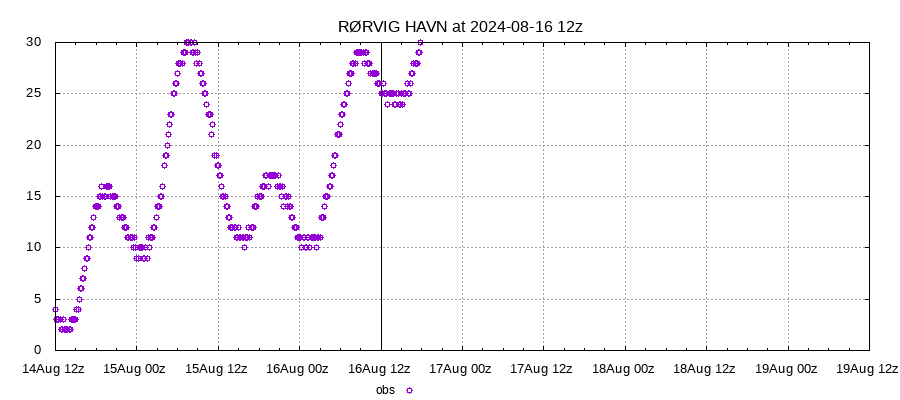
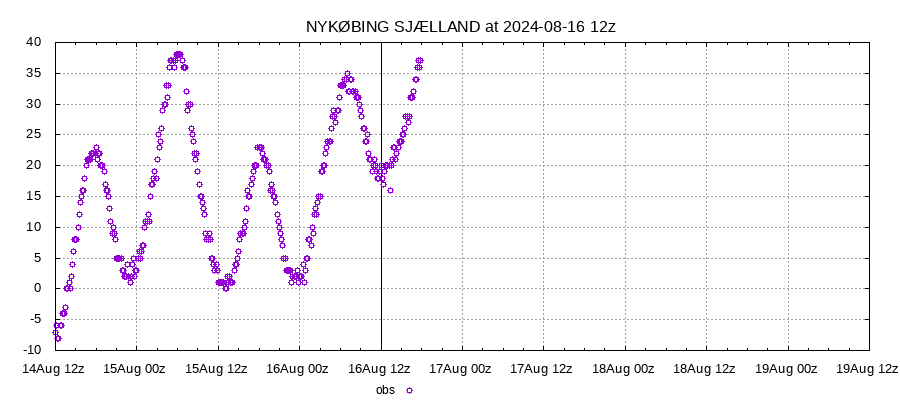
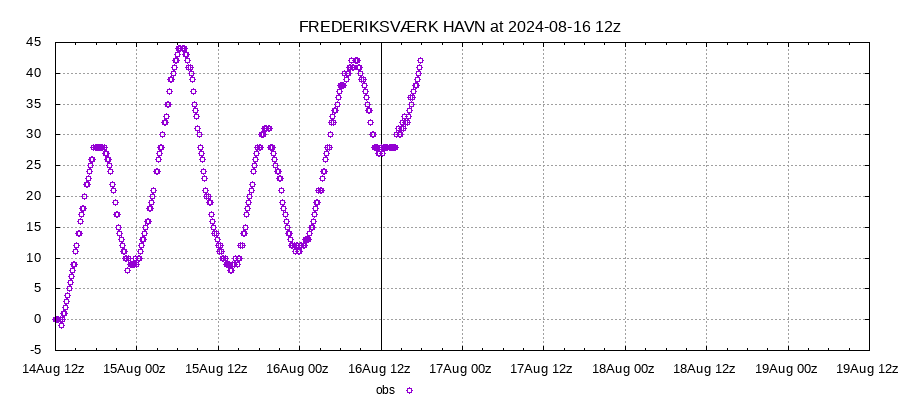
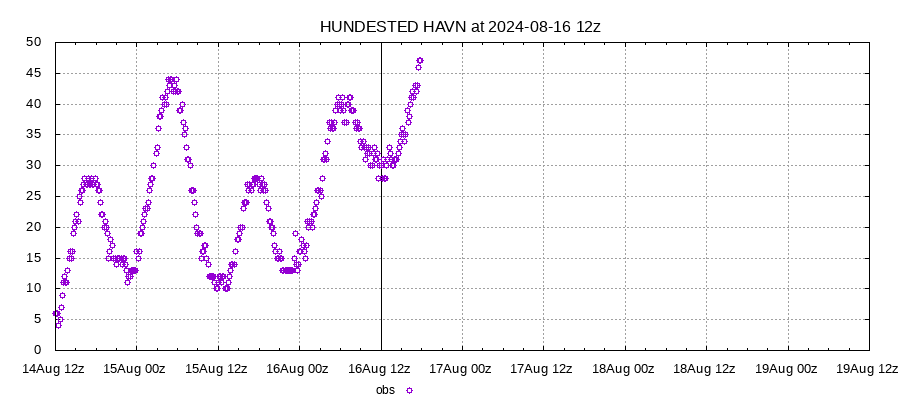
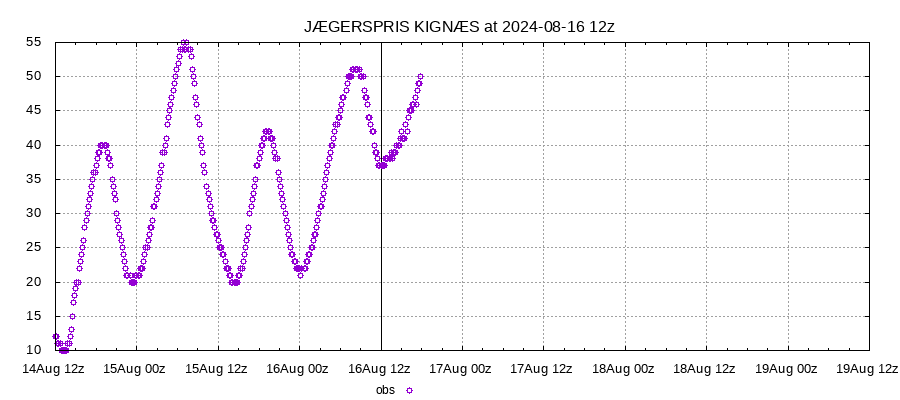
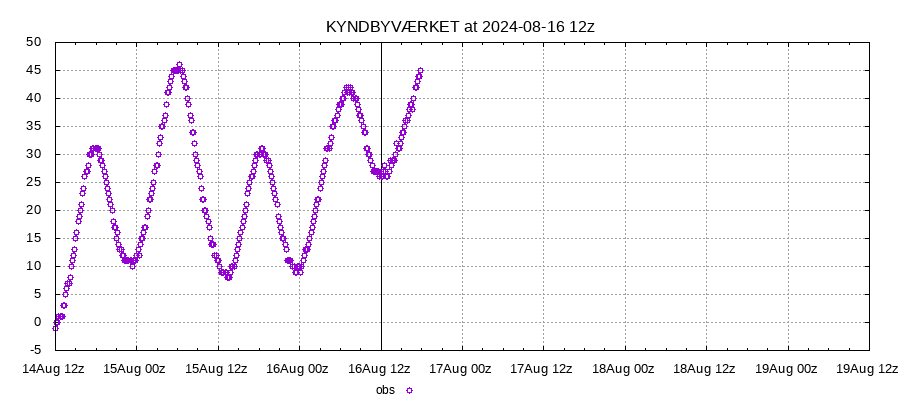
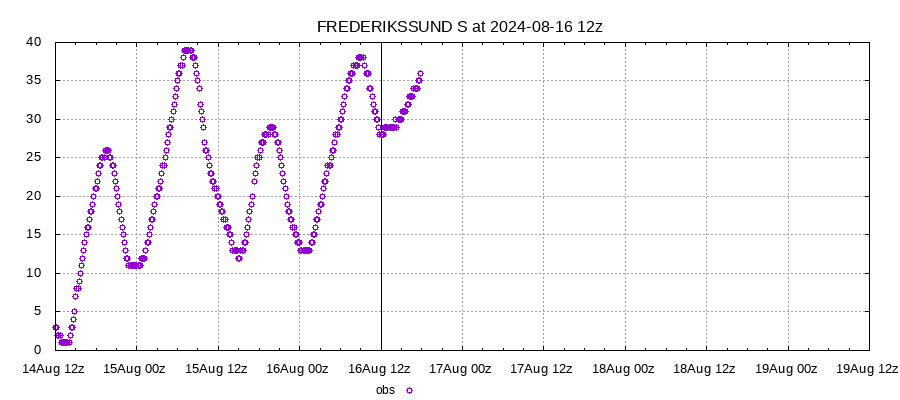
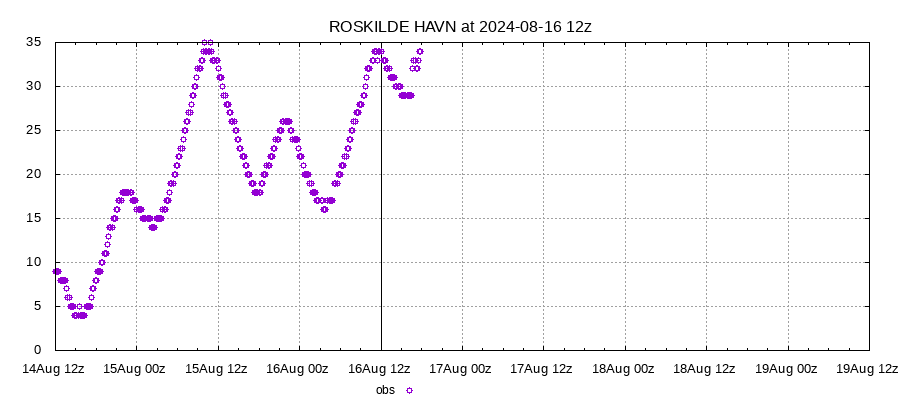
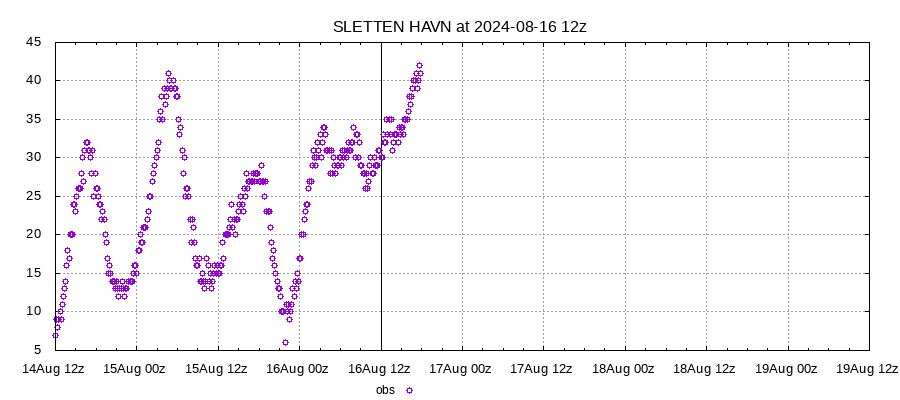
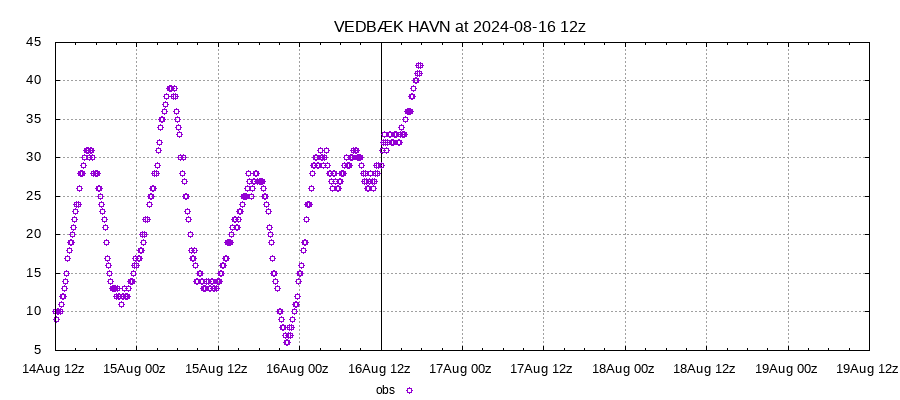
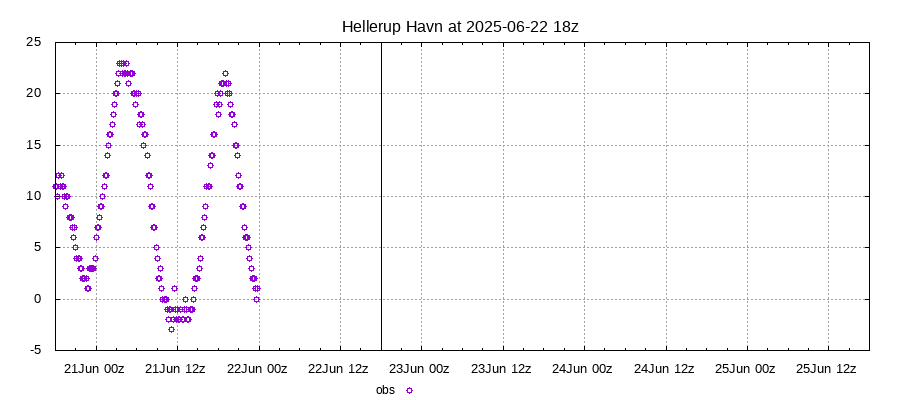
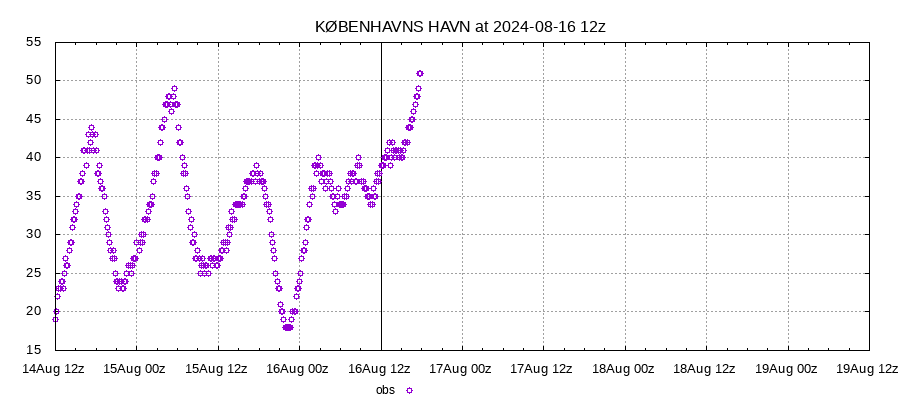
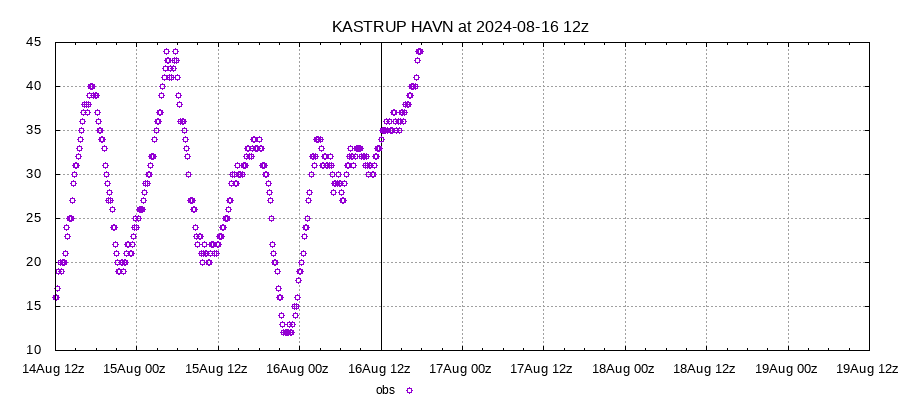
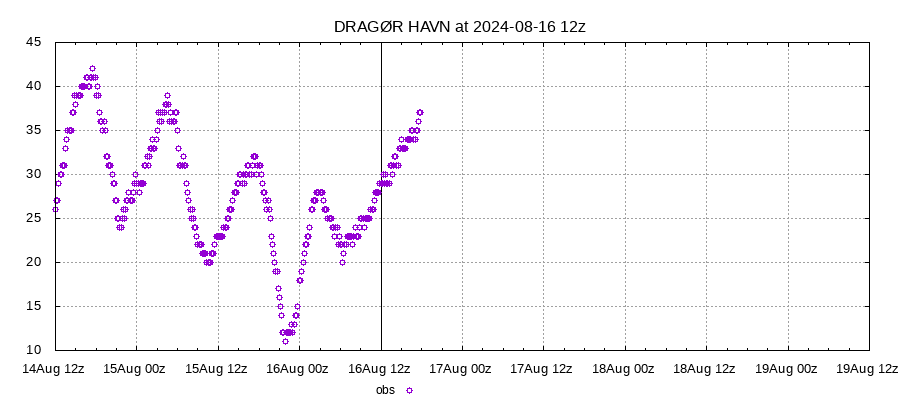
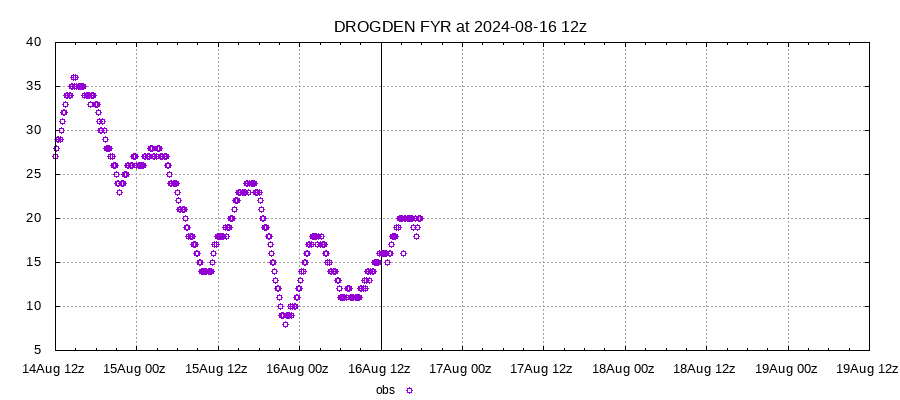
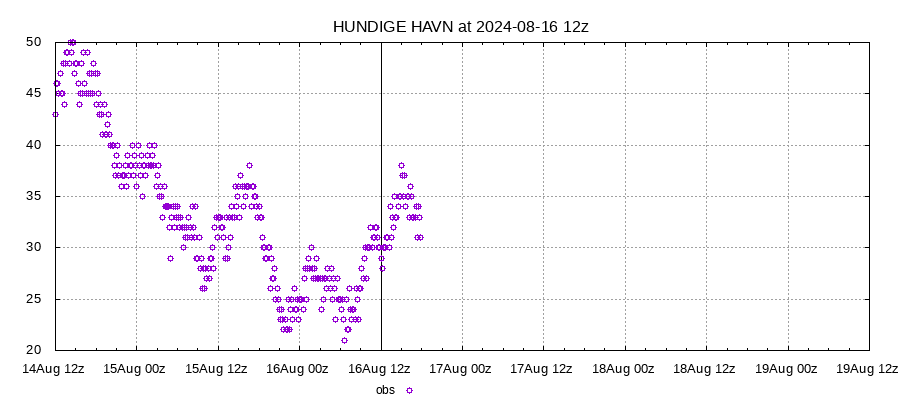
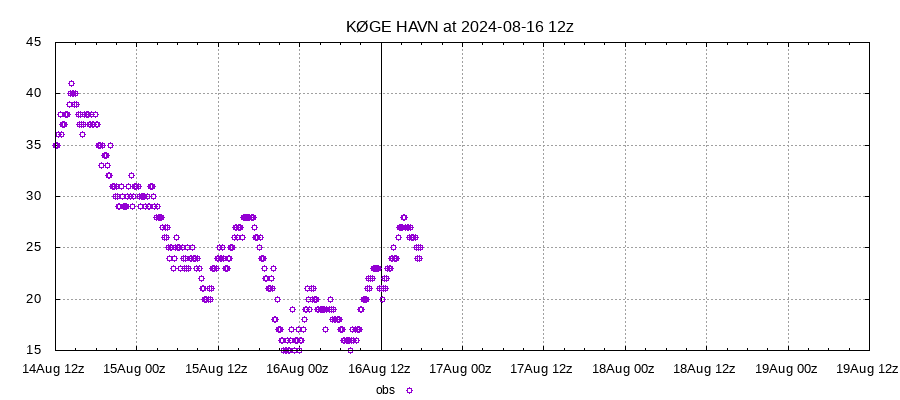
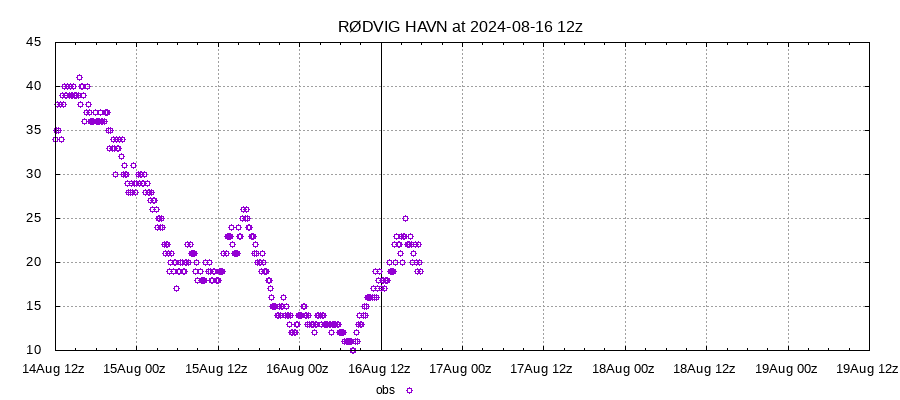
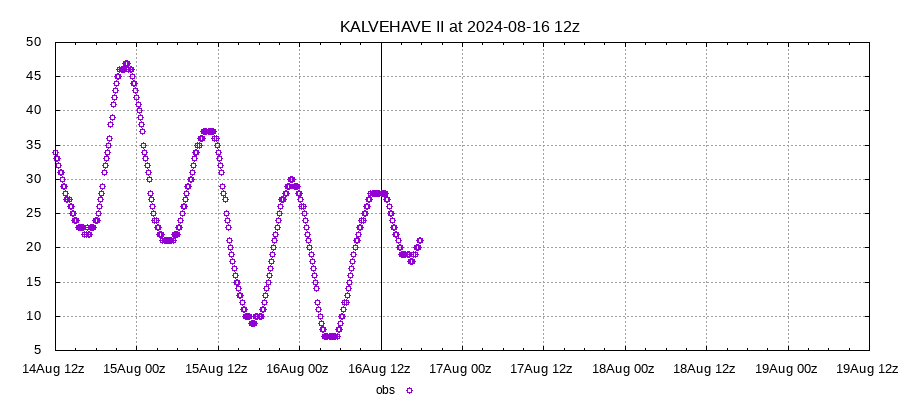
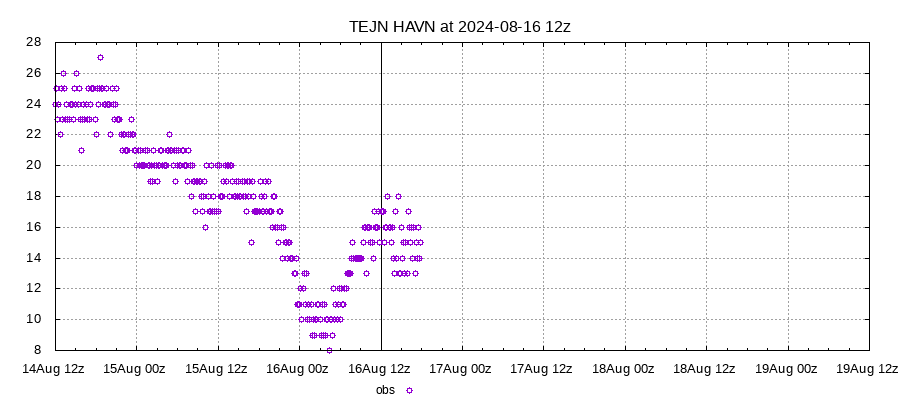
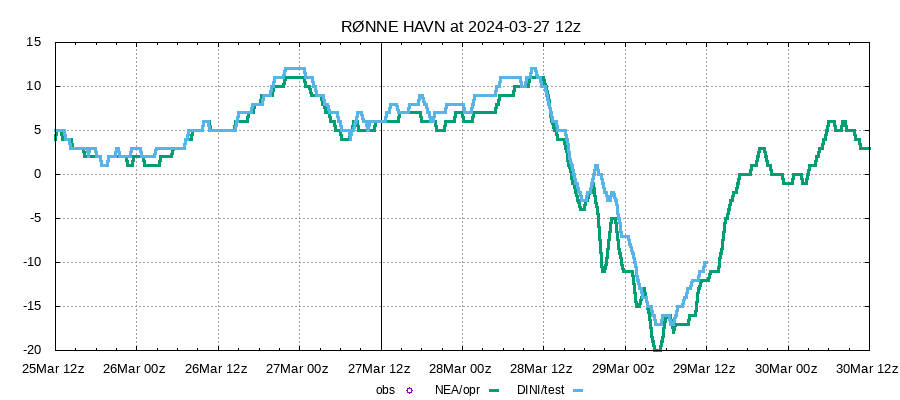
Observed and predicted, unbiased sea level
Sorted by warning district (1-20)
From T minus 2 days to T plus 3 day(s) ahead
Curve legend indicates analysis day/hour, most recent in black
Vertical bar indicates latest analysis
Last update=Fri Mar 20 06:01:04 UTC 2026 Next update=Fri Mar 20 12:01:04 UTC 2026