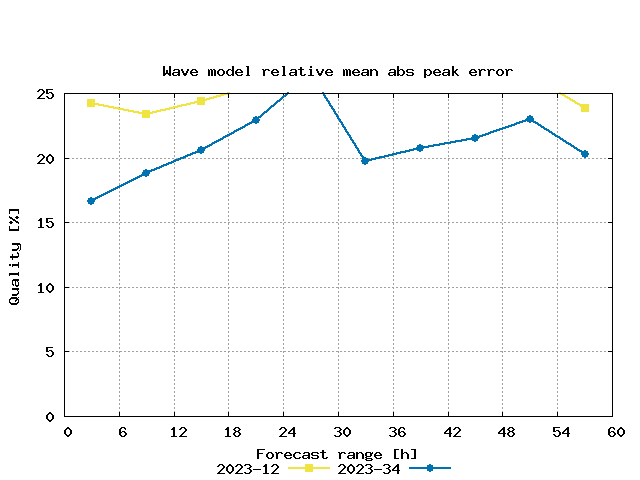
Quality measure
The quality
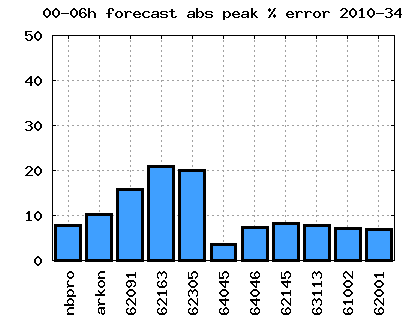
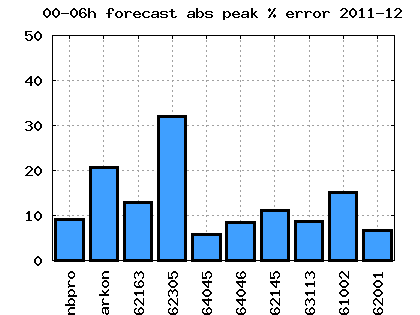
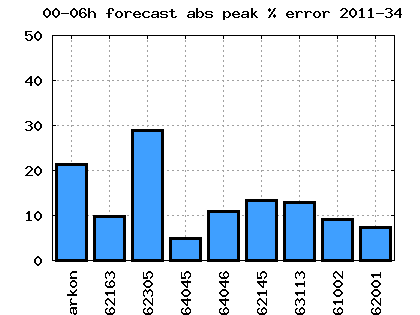
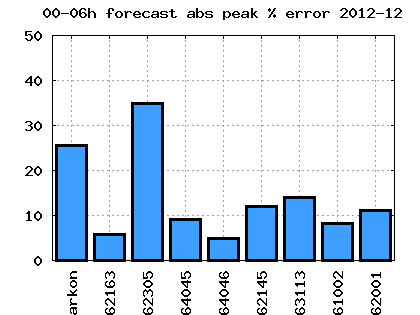
Q of operational wave forecasts.
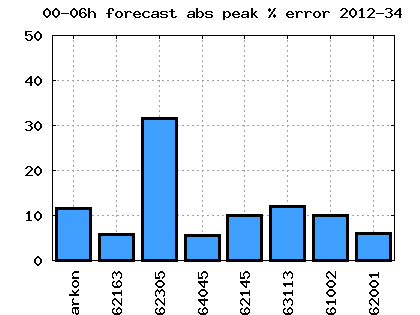
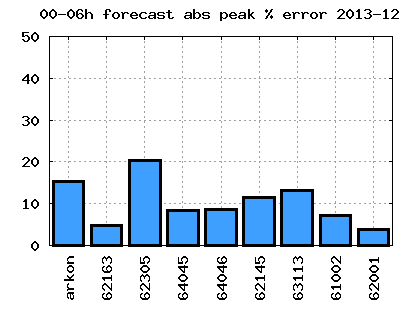
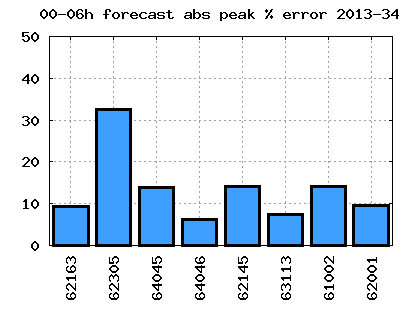
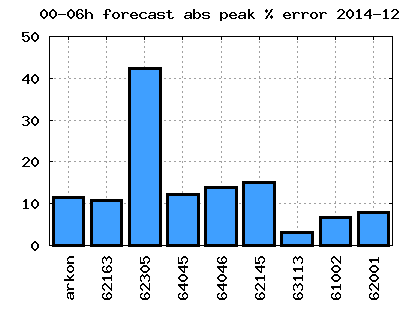
Q is the prediction error on the highest wave during a storm.
Q is given as absolute value in percent
We examine the 5 highest events at a fixed set of 13 buoys (see map below).
We examine six months of data at a time.
Q is calculated as a function of forecast range, in 6 hour intervals.
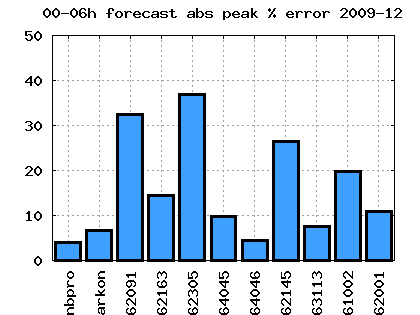
[ Calculation method:
HW = High Wave Event, HW1=highest, HW2=second highest, .., HW5=fifth highest
Relative Absolute Peak Error PE = 100 * | HW_obs - HW_pred | / HW_obs [%]
Mean for a station MPE = (PE1+PE2+PE3+PE4+PE5) / 5
Mean for all stations Q = (MPE_st1+...+MPE_stN) / N [N=number of stations] ]
All stations
Single station results
click on the map to pick a station
Single season results
2009-12
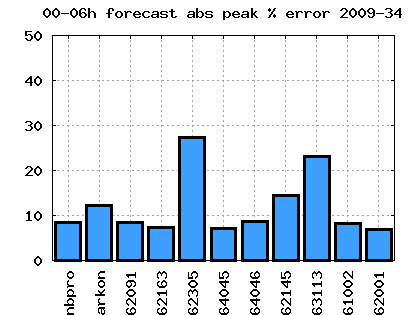
2009-34
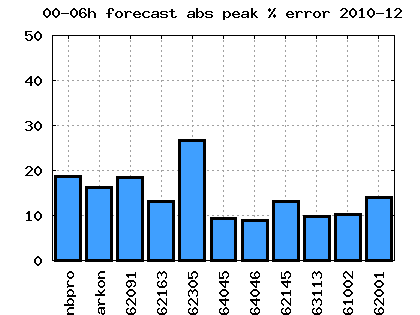
2010-12
2010-34
2011-12
2011-34
2012-12
2012-34
2013-12
2013-34
2014-12
....................
