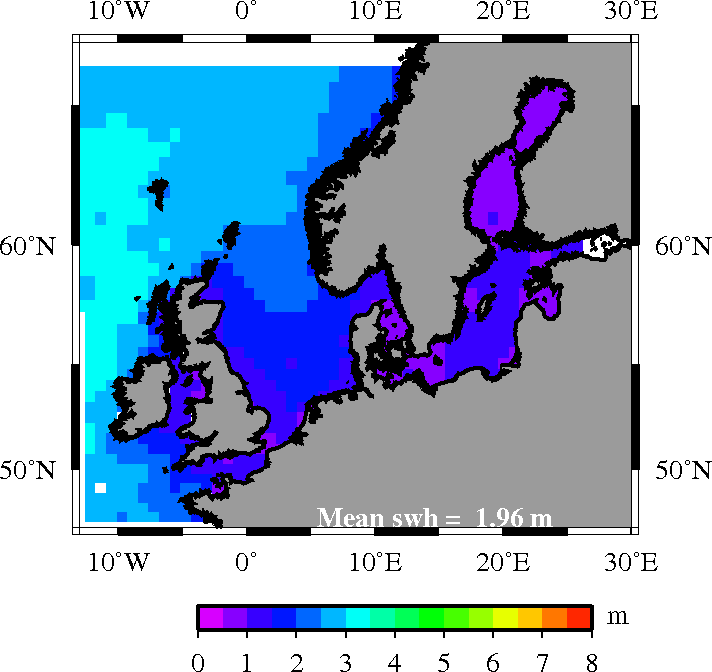
OBSERVATION: Significant wave height (SWH) conditions observed from satellite
Average satellite SWH
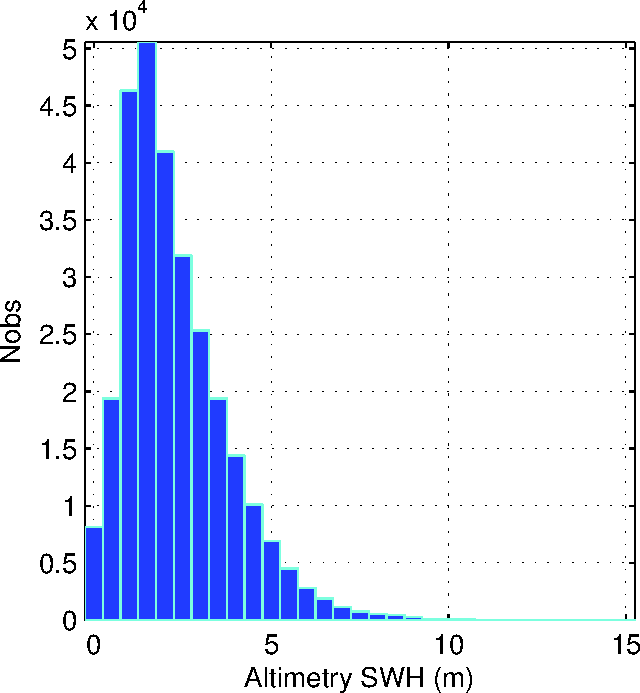
Histogram of all observations
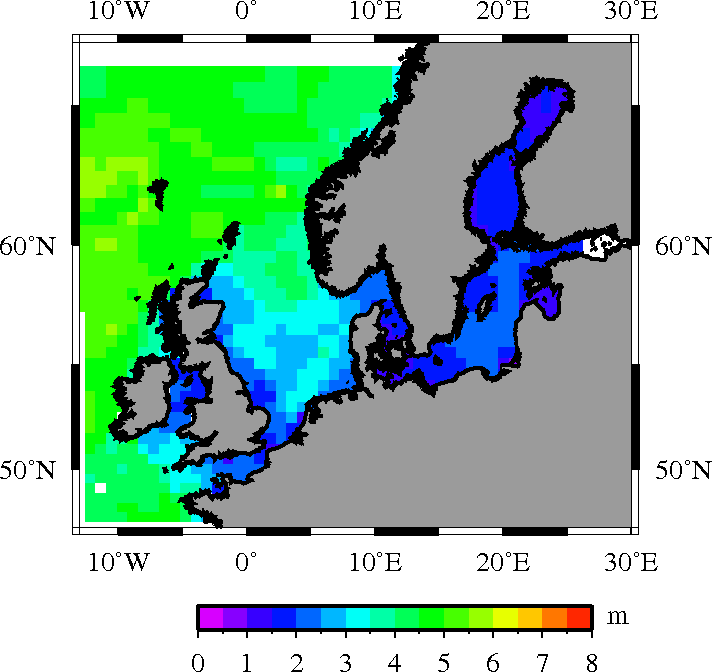
90% percentile of satellite SWH
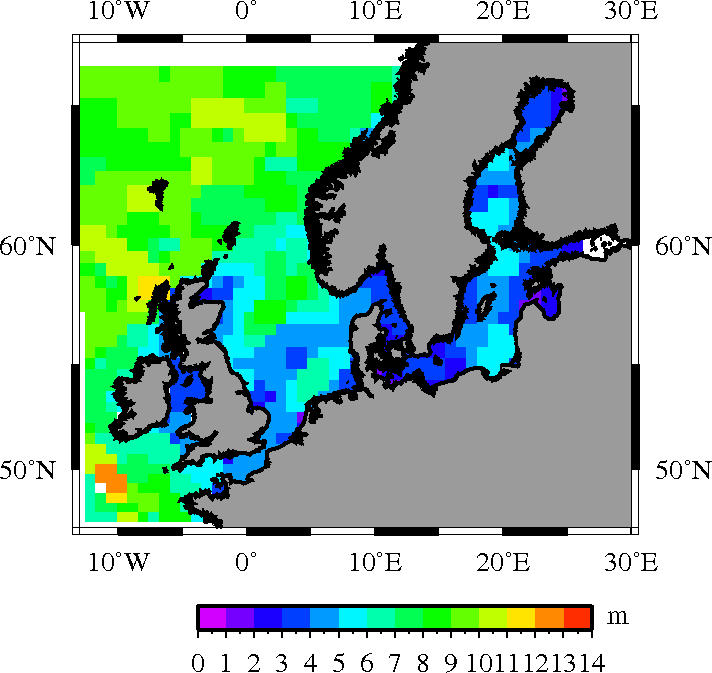
Maximum satellite SWH
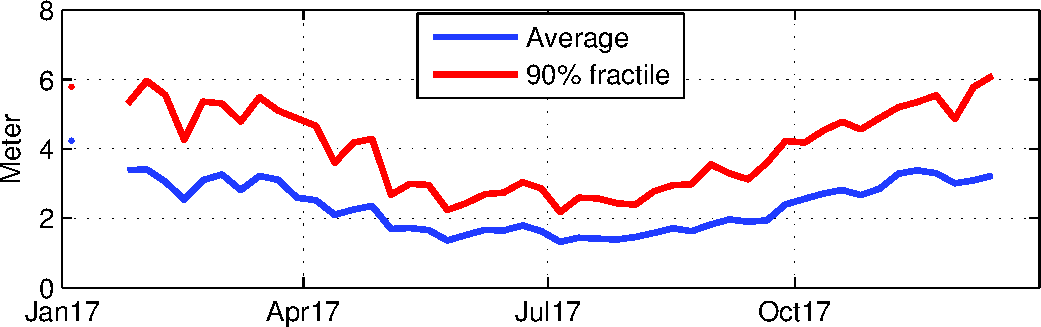
Weekly averaged satellite SWH and 90% percentile
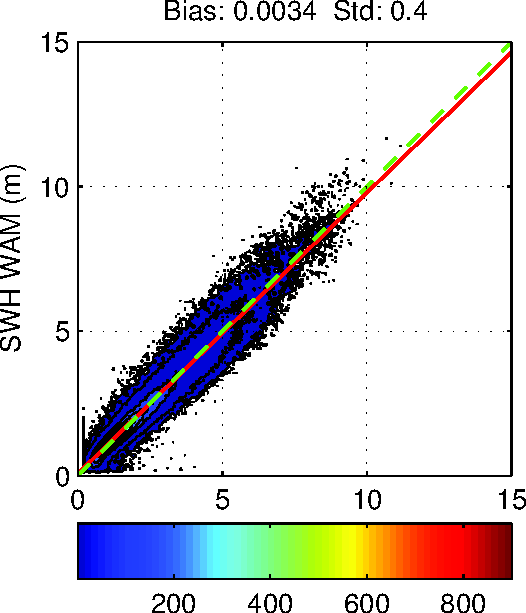
VERIFICATION: Scatter plot and mean errors
All pairs of WAM (0-6 hour) and satellite observations have been used.
The number of observations in each 5x5 cm box is shown with
colors. Red line : the best fit to data.
Green-dash line : one to one relationship.
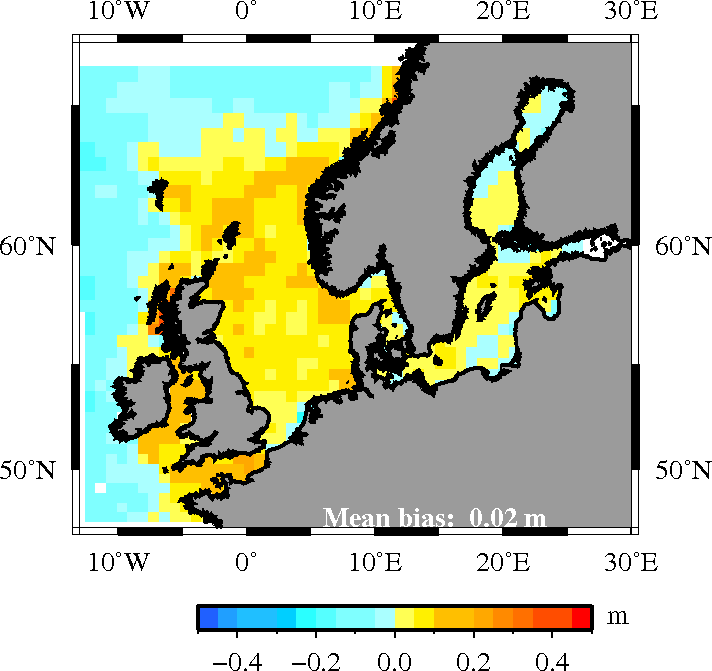
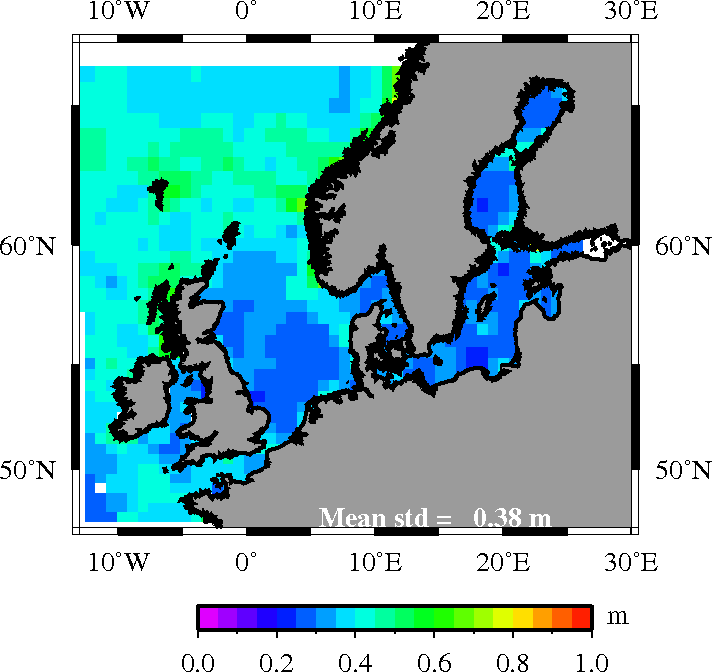
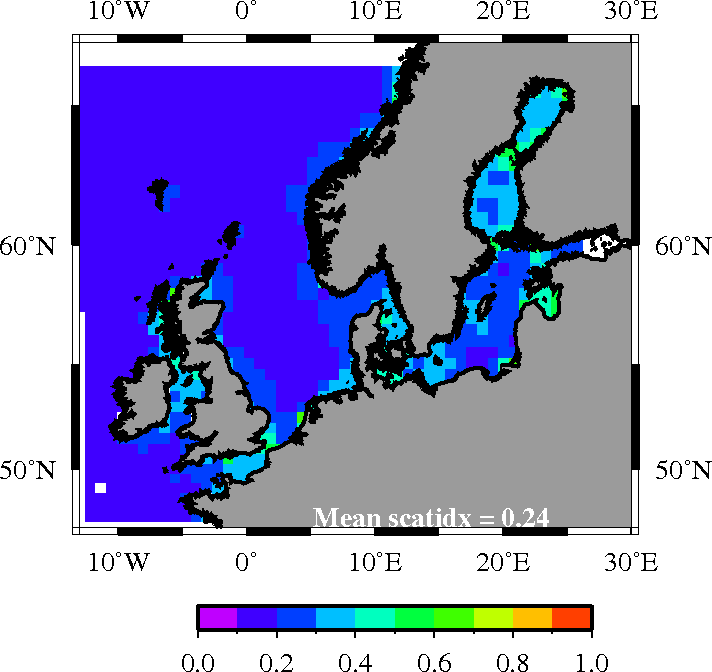
Error maps
Gridded to 100x100 km bins
Bias (WAM - altimetry)
Stddev
Scatter index
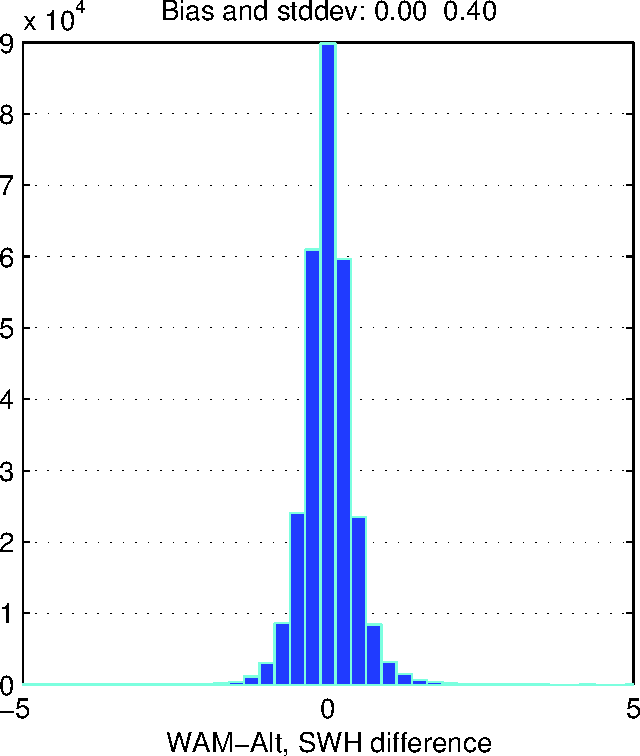
Histogram of comparisons
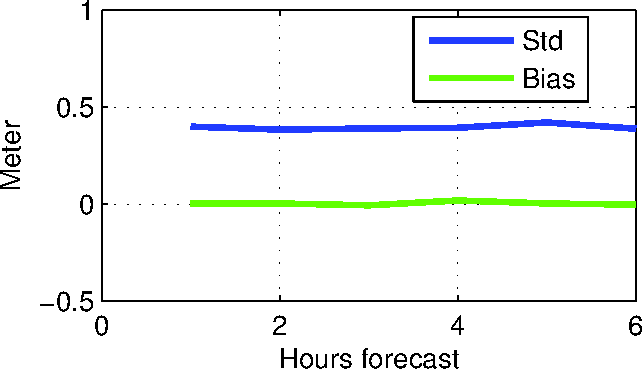
Error statistics vs. forecast length Domain average
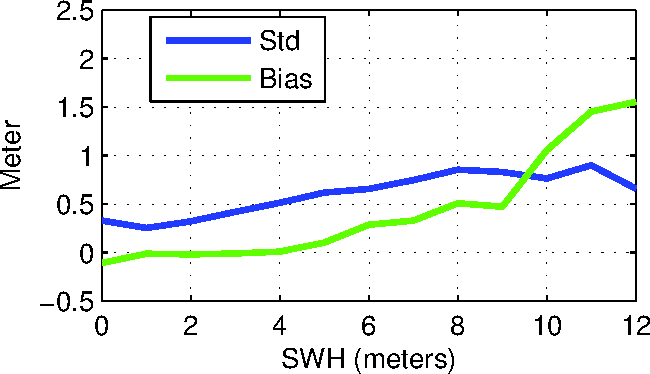
Error statistics vs. wave height 1 meter bin size
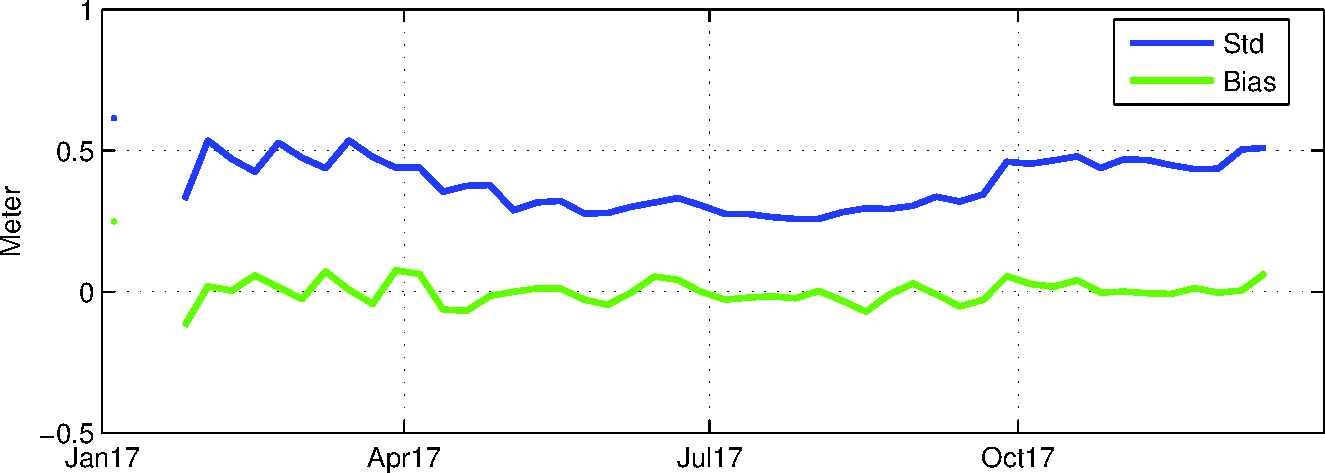
Error vs. season Weekly averaged
....................
jw - dmi/f+u - 2018-05-16
Ocean og Is - Danmarks Meteorologiske Institut - Sankt Kjelds Plads 11
- 2100 København Ø. Tlf: +45 39 15 75 00 -
Kontakt DMI - Tilgængelighedserklæring