Modeled ice thickness and volume
The plots show maps with sea ice thickness, and seasonal cycles of the calculated total arctic sea ice volume. The mean sea ice volume and standard deviation for the period 2004-2013 are shown with gray. The figures are based on calculations using DMI's operational ocean and sea ice model HYCOM-CICE.
|
|
|
|
|
More info here.
|
|

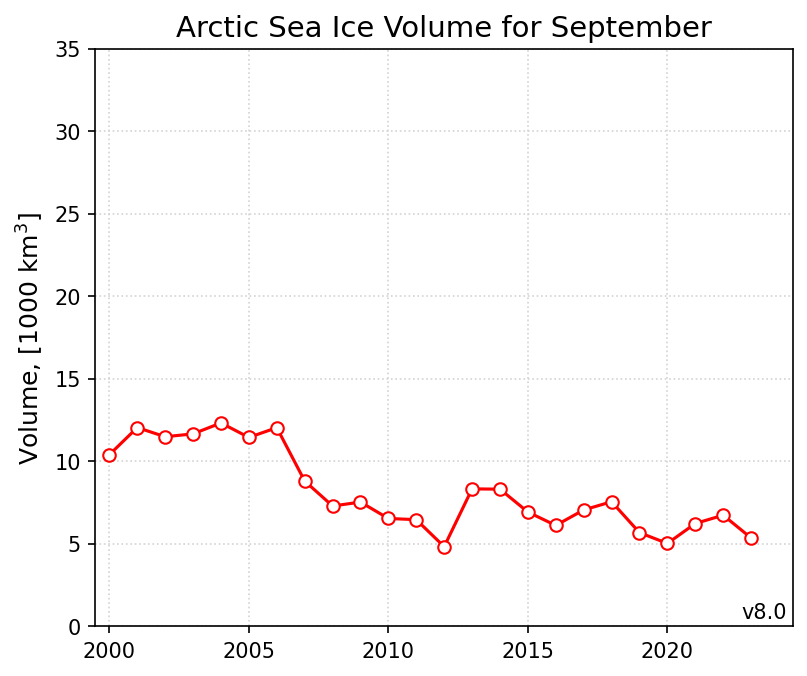
The monthly total volume of sea ice in the Northern Hemisphere for the past 25 years.
The ice volume in September corresponds to the minimum extent of the year.

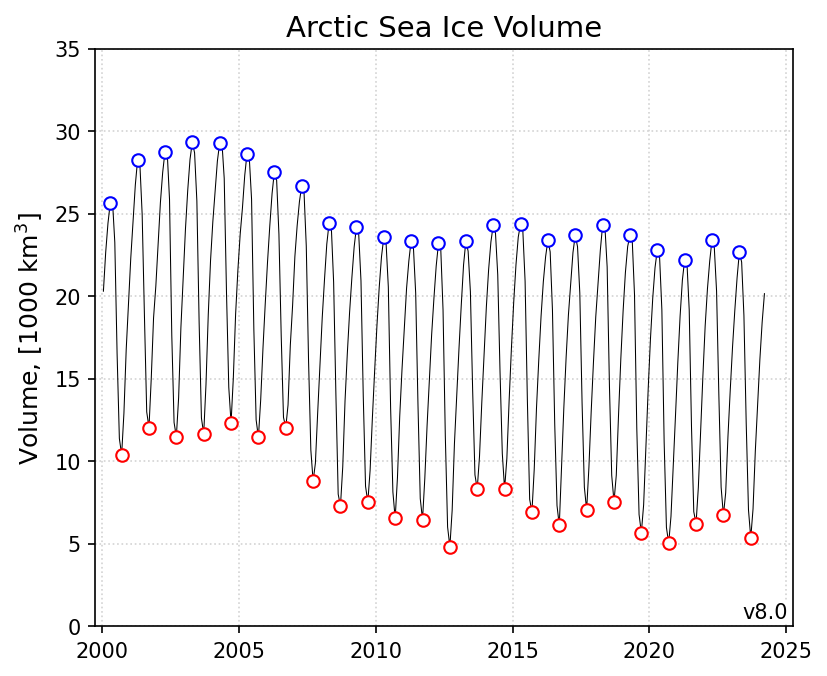
The monthly total volume of sea ice in the northern hemisphere in the past 25 years.
Markers are shown for September (red) and April (blue)
which corresponding to the year's minimum- and maximum volume.
|
