|
|
 |

|

The SALIENSEAS project, part of the ERA4CS programme, is co-funded by the Innovation Found Denmark and by the Horizon 2020 Framework Programme of the European Union (Grant 690462). |
Iceberg Atlas
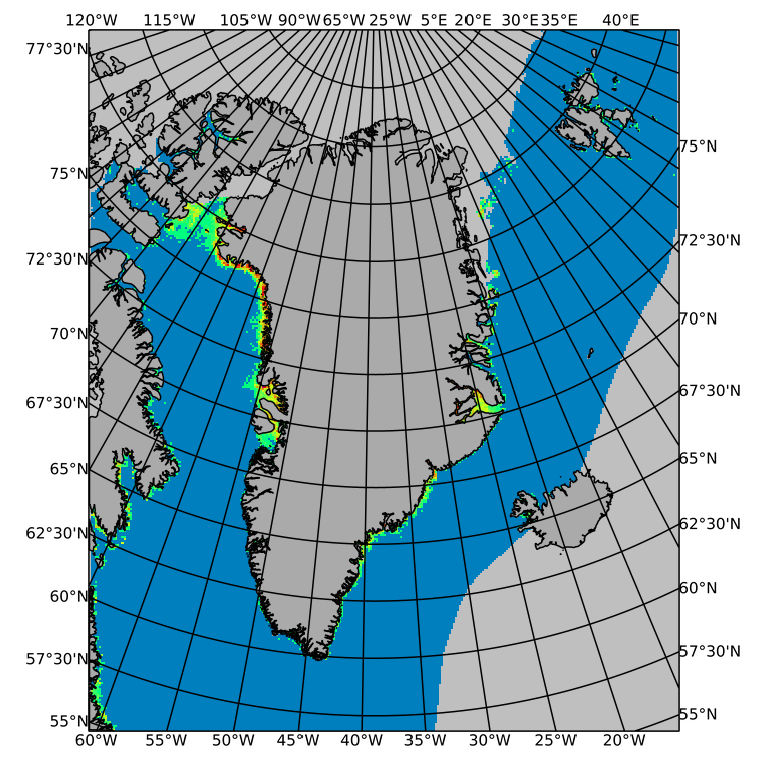
This atlas shows the seasonal distribution of the icebergs - observed from space - in the waters around Greenland; it is a service developed- and provided by the SALIENSEAS project. The atlas consists of a series of maps that displays iceberg statistics for each of the 52 weeks of the year. Note that the maps show statistics on icebergs detected in open-water only. This is due to the presence of rugged structures in the sea ice (such as ridges and rubble fields), that make iceberg-detection in sea-ice infested areas uncertain. Further information about the atlas can be found here: Download the iceberg atlas (pdf) |
|
Number of icebergs: Maps displaying climatological conditions
Explore how many icebergs usually exist around Greenland under different conditions. Select a week number and then hover the mouse over the blue buttons. Click the buttons to open a zoomable map in a new window. |
|
|
|
|


|
|
|
This demonstration product was developed in the project SalienSeas, part of the ERA4CS programme. Find other SalienSeas products here: http://ocean.dmi.dk/salienseas |
|