The DMI operational storm surge model
The DMI storm surge model DMI-BSHcmod calculates sea level changes in the North Sea - Baltic Sea region
generated by wind, air pressure (obtained from a numerical weather prediction model) and tides.
Furthermore, the model provides a description of generel hydrography (temperature, salinity, ice cover)
as a function of freshwater inflow, radiative heat uptake, and heat exchange with the atmosphere.
This is used to forecast sea level in general, and extreme high waters
(storm surges) in particular. The forecasts run 2˝ days ahead.
DMI-BSHcmod is developed by Bundesamt für Schiffahrt und Hydrographie (BSH)
in Hamburg, Germany.
Model description (html)
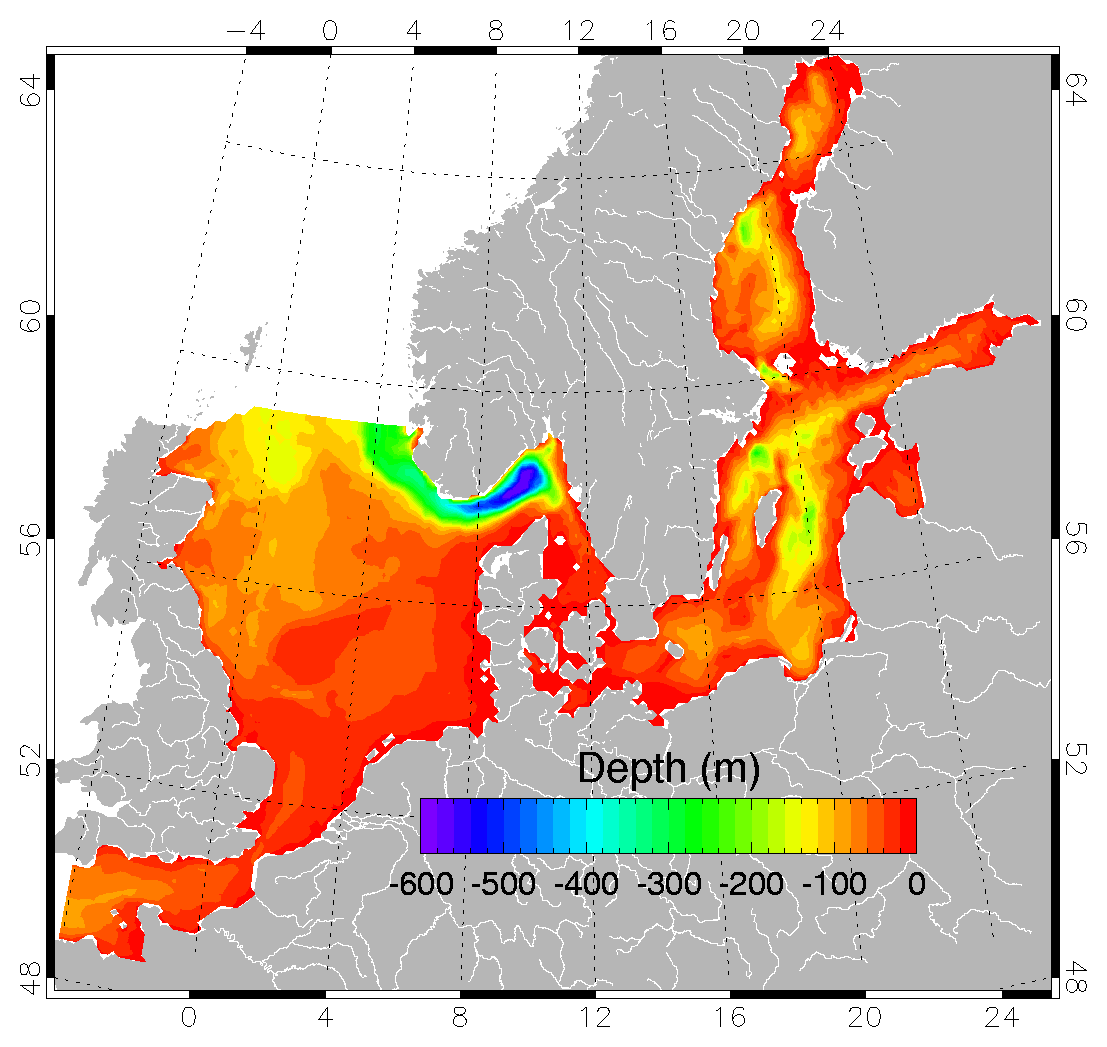 Storm surge model nested grid set-up
Test models / Exchange models
DMI runs two more storm surge models (2d) ) covering the North Sea - Baltic Sea.
Both of these models provide extra sea level forecasts for Danish Waters,
and are verified along the same lines as the operational model.
DMI further receives sea level predictions from partner institutes,
to be used in warning situations.
Tide gauges
Tide gauge data are retrieved from the DMI data base, where all on-line
danish tide gauge data are routinely stored.
The data providers are the DMI, the Coastal Authorities, the Royal Danish Administration
of Navigation and Hydrography, and a number of local authorities.
Station list
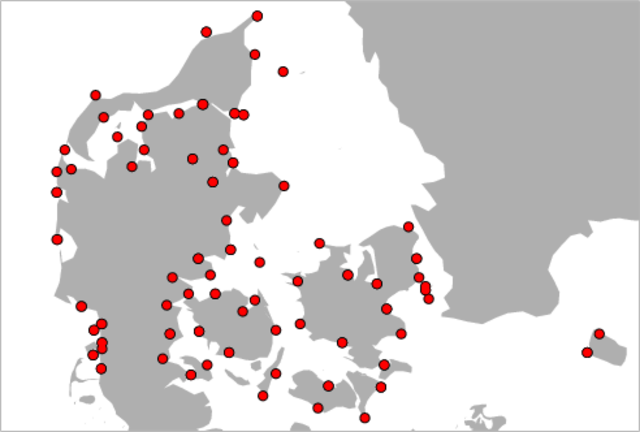
Danish tide gauge stations
Storm surge verification
Is done each year in January, for the preceding calendar year.
Sea level predictions are compared with danish coastal tide gauge data,
and the result is reported at this web site.
In addition to this, a special high water error measure Q (see below) is updated once a month.
Error measures
We calculate error statistics for all stations with a reasonable winter season data coverage
Standard error
The standard error (residual) is the difference between observed and predicted sea level
at any given time.
The mean error (bias), r.m.s. error (rms),
explained variance (ev) and correlation coefficient (cc)
are calculated for each station in turn. This is done as a function of forecast range.
High water (peak) error
The peak error pe is the difference between the highest predicted
and the highest observed sea level
during a storm. Actual and predicted time of the maximum may differ by several hours.
The peak error is calculated for the 10 highest events at each station,
separated by at least one tidal period. False alarms are not considered.
The peak bias (pb), and peak % bias (pb%), are the average error of the 10 events.
Key numbers
Obtained by averaging the error measures described above over a fixed set of stations.
Key numbers have been calculated since 1998.
Quality
In order to describe the quality of the storm surge model system - the model result -
in a simple way, one single figure Q is defined.
Q is the mean absolute peak % bias of the 3 highest peaks at 18 pre-selected stations.
Q is calculated once a month, as a running 12-month average.
This is part of the DMI-ministry resultatkontrakt since 2003.
....................
Jacob Woge Nielsen - January 26th 2010
