Quality measure
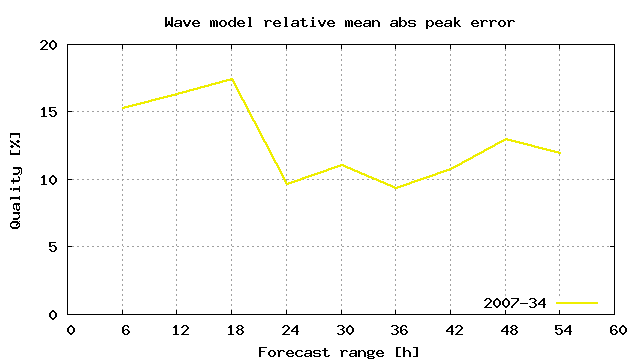
The quality
Q of operational wave forecasts
is calculated by comparing one half year of observed and predicted peak wave height.
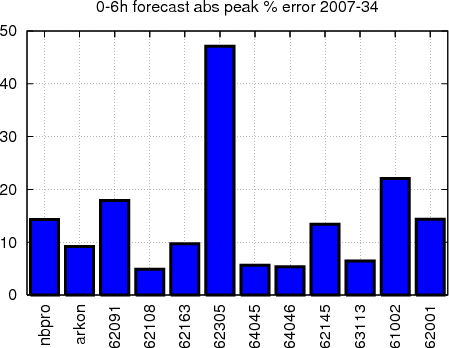
Q is defined as the absolute peak error in percent,
averaged for the 5 highest events at a fixed set of 13
buoys, as shown on the map at the page bottom.
Q is calculated as a function of forecast range,
in 6 hour intervals.
[ Calulation method:
HW = High Wave Event, HW1=highest, HW2=second highest, .., HW5=fifth highest
Relative Absolute Peak Error PE = 100 * | HW_obs - HW_pred | / HW_obs [%]
Mean for a station MPE = (PE1+PE2+PE3+PE4+PE5) / 5
Mean for all stations Q = (MPE_st1+...+MPE_stN) / N [N=number of stations] ]
Results - all stations

Single station results
click on the map to pick a station
Single season results
|
Station comparison, 2007-34
|
 |
