DMI uses 3 types of statistics for significant wave height:
- Statistics based on wave model data
- Statistics based on satellite observations
- Statistics based on observations from lightships
Wave model statistics
DMI has analysed operational short range (1-6h) significant wave height forecasts,
produced by the DMI met-ocean forecast model system based on the limited area nwp model
Hirlam
and the wave model
WAM.
What results is wave height probability distributions for each of five wave model domains:
- North Atlantic (7 years of data)
- The Mediterranean (5 years of data)
- The North Sea - Baltic Sea (3 years of data)
- The danish Transition Area (3 years of data)
- The Yellow Sea (1 year of data)
The wave height statistics have been calculated for every model grid point,
totalling about 50.000 data points.
This has been done on a monthly basis, for each season, and for the annual data.
We have three ways of presenting the statistical results:
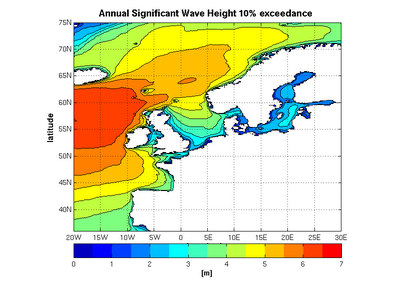
| 1: Map of level of exceedance, printed for the 10%, 20% .. 90% levels,
and for the 1% level representing maximum significant wave height.
The map is bounded by EWSN lat/lon limits. |
 |
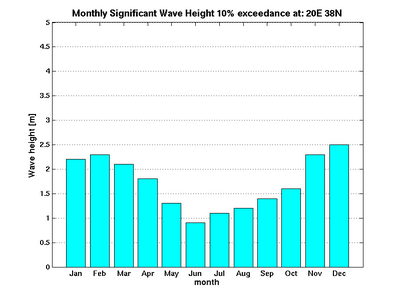
| 2: Monthly distribution of level of exceedance for a single point,
presented as a bar diagram for the same levels as above.
|
 |
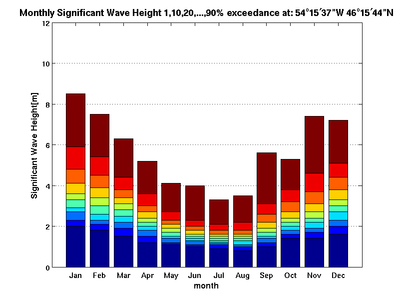
| 3: Stacked monthly distribution for the same levels as above.
|
 |
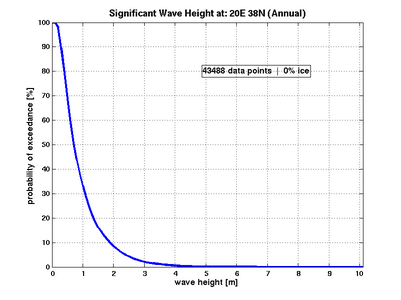
| 4: Probability distribution of significant wave height at a given point,
presented graphically and in table format.
The graphics contains information on the amount of data used
and periods with ice cover. |
 |
Satellite data
Worked out by I. R. Young og G. J. Holland, published in:
Atlas of the Oceans: Wind and Wave Climate, Springer, 2004.
The observations were done by the GEOSAT satellite, 1986-1990.
Covers the globe in a 4x4 degree grid,
with the exception of high latitudes
because GEOSAT did not orbit the poles.
Lightship data
Published by DMI in Nautisk Meteorologisk Ĺrbog 1897-1961, later in
Oceanografiske Observationer 1962-197x. The last of 10 lightships
was taken out of service in the mid-1970'ies. In 1982, DMI published a 30 year wave
climatology for the period 1931-1960, based on these data
(A.Sparre: Klimatologiske Meddelelser, DMI 1982).
This includes probability distribution of significant wave height
at each of the vessels, specified for each of 8 compass directions
and for the 12 months of the year.
The lightships served the ship traffic in danish waters, and most were
located near underwater reefs.
Excerpts from the lightship climatology may be requested from DMI.
Future work
Expand the wave model statistic to cover 40 years,
in order to get more reliable results.
This will be done using the ERA40 re-analysis,
comprising weather data for the period 1958-2000.
