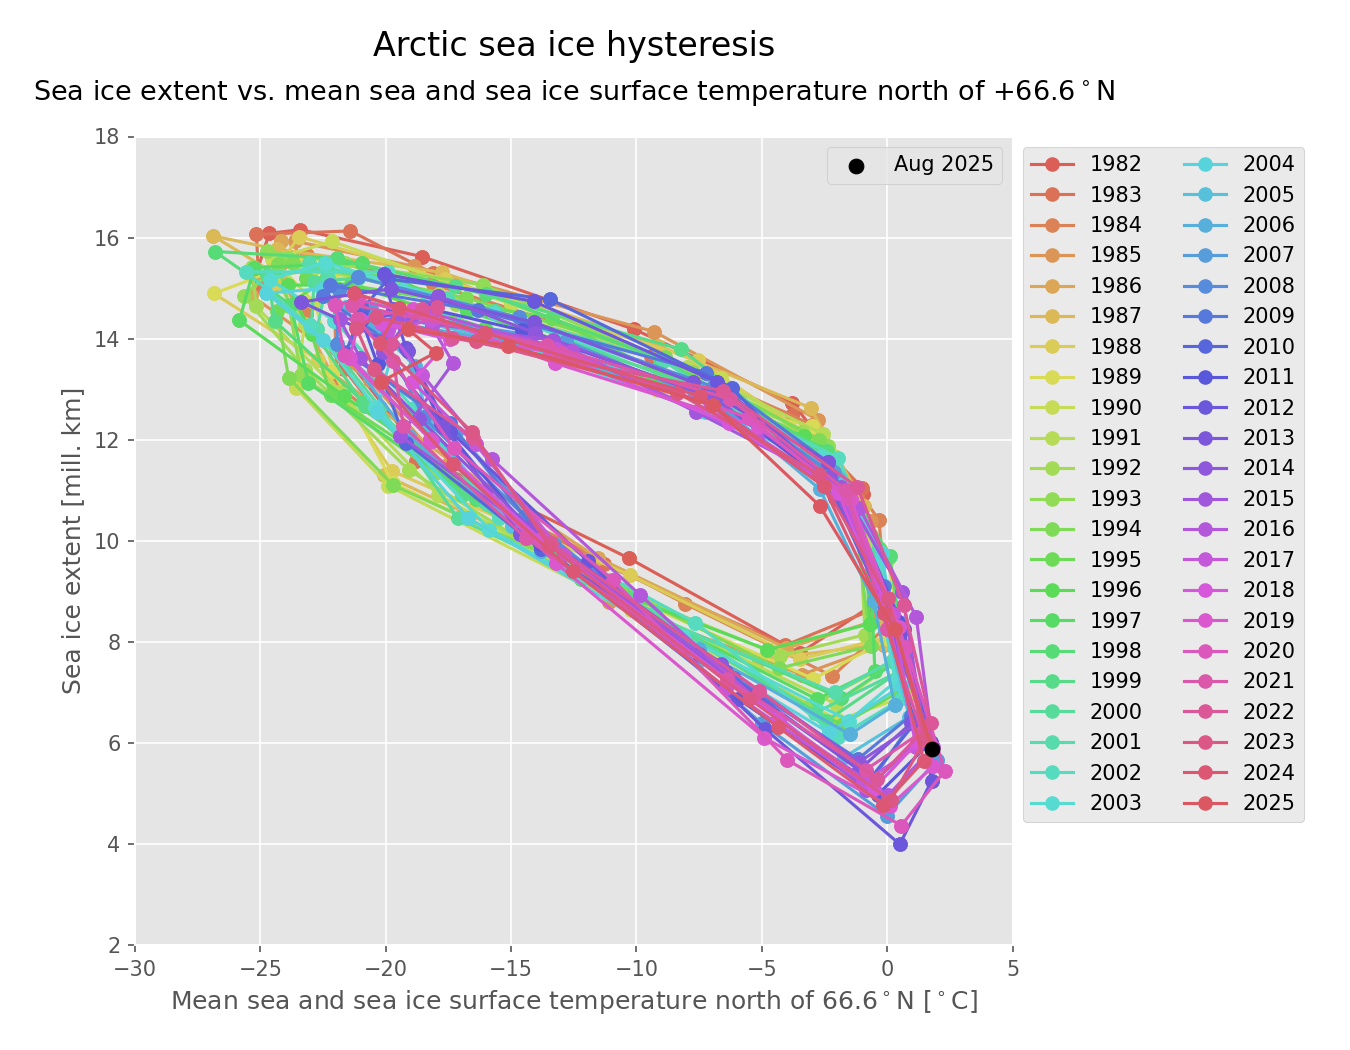
The Arctic Sea Ice Extent (SIE) and the associated Ice Surface Temperature (IST) are highly correlated variables. The SIE increases during the Arctic cooling period and decreases during warming period. This interaction was for many years a rather stabile hysteresis system, where the SIE assumes 2 states for the same mean temperature, depending on whether the IST is increasing (in spring) or decresing (in autumn). Since 2007, where the largest loss of multy-year ice in recent time occurred, the earlier rather predictable hysteresis loop has changed significantly.
The SIE-IST hysteresis is illustrated in the animated figure, where monthly pairs of SIE and IST since 1982 are plotted.
2024 Nov. 22th update::
The sea ice extent index has been changed. Previously it was calculated from the data set from Copernicus Marine mentioned above.
We now use the OSI-SAF 420 sea ice index.
We also extended the time series with data from a Near Real Time product as mentioned above to have the hysteresis show the latest development in the sea ice.