|
Arctic Sea Ice Extent
|
 |
Sea Ice extent - explanation on an appearent divergence between algorithms.
DMI has removed the old sea ice extent graph to focus the attention on the new graph that is based on data from an improved algorithm.
However, the removal of the old sea ice extent graph was done at an unfortunate time, namely, during a period where it seemed that the new and old ice extent plots disagreed (see figure 1). Naturally this has led to discussion among our dedicated followers, about the "true" ice extent. The apparent elevated sea ice extent in the data from the old extent algorithm was an artifact, caused by a new and higher resolution coast mask.
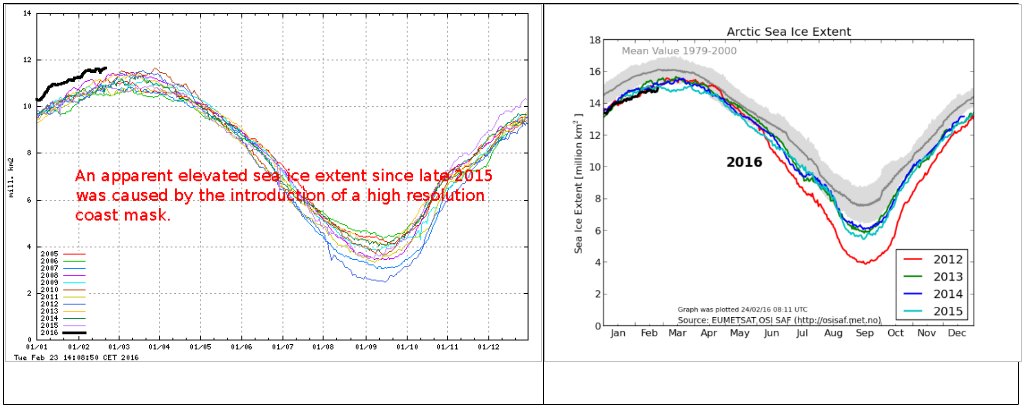
An off-line update of the old sea ice extent plot (left), where it appears that the sea ice extent is much larger than previous years and
the sea ice extent from the operational algorithm (right), which is DMI's and the Ocean and Sea Ice, Satellite Application Facility
(OSISAF)
official estimate.
Most of our sea ice extent followers know that the old plot includes a coastal mask, inside which sea ice was is accounted for. In summer 2015 this mask was refined and the masked region was subsequently smaller, thus leaving mo re area for classified sea ice and open water. The difference in masked area, before and after summer 2015, is approximately 1.4 million km2. This corresponds to difference of the blue coast lines in figure 2, showing the old and new coastal masks in the left and right panels, respectively. The difference may be difficult to detect on the figure, but the area is quite significant. The increasing sea ice extent that is caused by the new coast mask is not great during summer, because sea ice has a relative short line of contact with land during summer. But the new and finer coast mask will result in increasingly more sea ice, compared to previous years during winter, as the coast line with sea ice contact is increasing. This is the reason for an increasing sea ice extent during current freeze-up period, relative to previous winters. A comparison of the 2015/2016 sea ice extent with previous years does therefore not make sense (see figure 1-left).
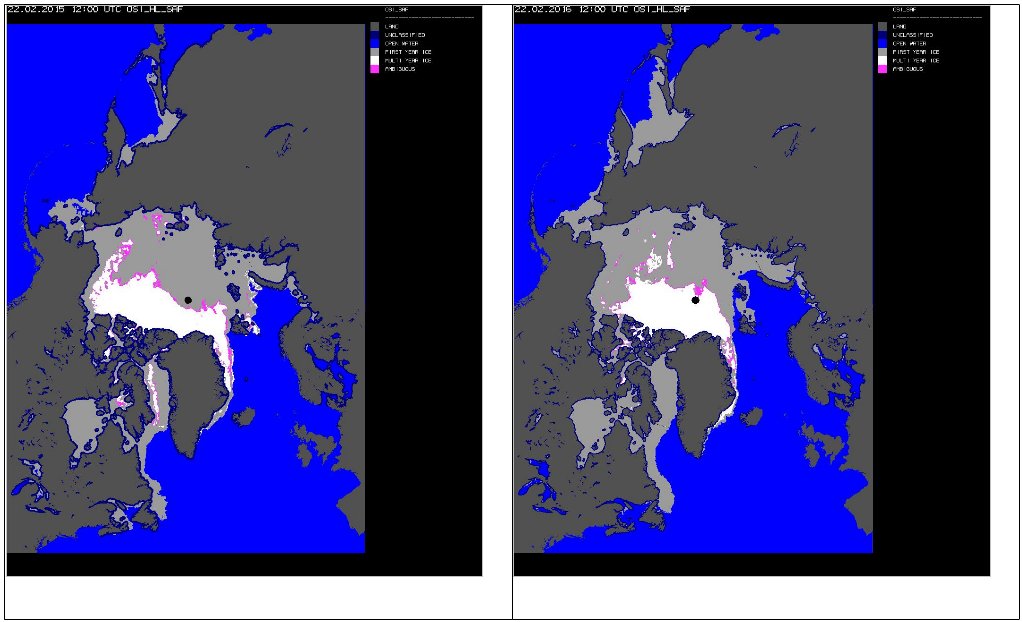
Plots of sea ice types February 22 2015 (left) and February 22 2016 (right) using 2 different coast masks.
The mask used before summer 2015(left) is wider than the new mask (right), corresponding to approximately 1.4 million km2 less area under the new mask.
Because of the deprecated status of the old plot in the past year, DMI has not been monitoring these irregularities. The old plot should, of cause, have been removed when the mask was replaced. DMI apologizes for the confusion and inconvenience this has caused.
|
|
|
