Annual anomaly of the +80N mean temperature index
The +80N temperature anomaly is calculated as the annual mean temperature minus the corresponding climate temperature, i.e. the long-term (1958-2002) average temperature. It can be calculated from the daily +80N graph as the red curve minus the green curve. Hence, positive values indicate a warmer year than the average climate and vice versa. Deviations of mean seasonal temperatures from the climate mean are calculated in a similar way, and are also displayed on the graphs.
As described in the data information sheet, the +80N mean temperature index is not a climate data record. Since 2002, the daily mean temperatures are calculated from the operational atmosphere model at ECMWF, and changes in the operational model over time may affect the resulting temperature trends. The effect of this should be considered before making firm conclusions on basis of trends in the +80N climate indices.
The Arctic region has witnessed a rapid increase in mean temperatures since the beginning of the millennium; Arctic winter temperatures in particular have been up to 8oC above normal during recent years. This temperature increase is much higher than the global average, an effect known as Arctic Amplification, and it is primarily driven by albedo feedbacks caused by changes in snow and ice on land and loss of the Arctic sea ice.
|
Annual, Summer and Winter anomaly.
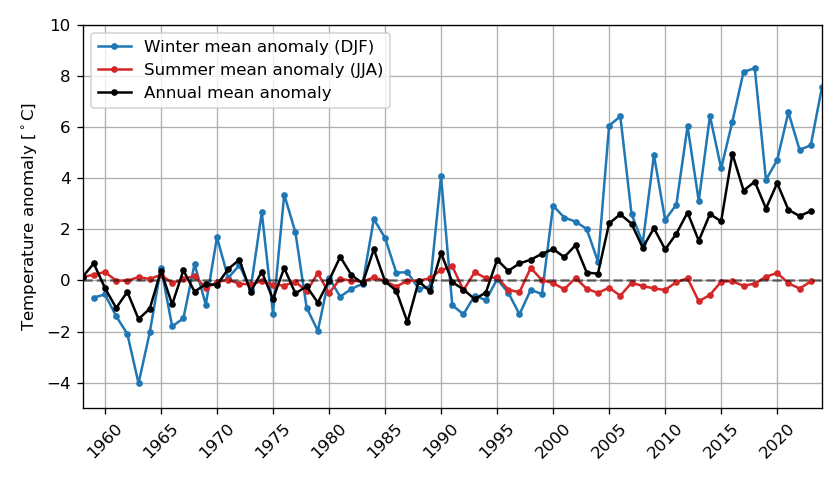
Anomaly of the +80N mean temperature index, compared with climate (annual mean
minus the corresponding climate value). All year anomaly is illustrated with the black
line, summer anomaly (June, July, August) is illustrated with red and winter anomaly
(December, January, February) in blue. Reference climate is ECMWF-ERA40
1958-2002.
Annual, Spring and Autumn anomaly.
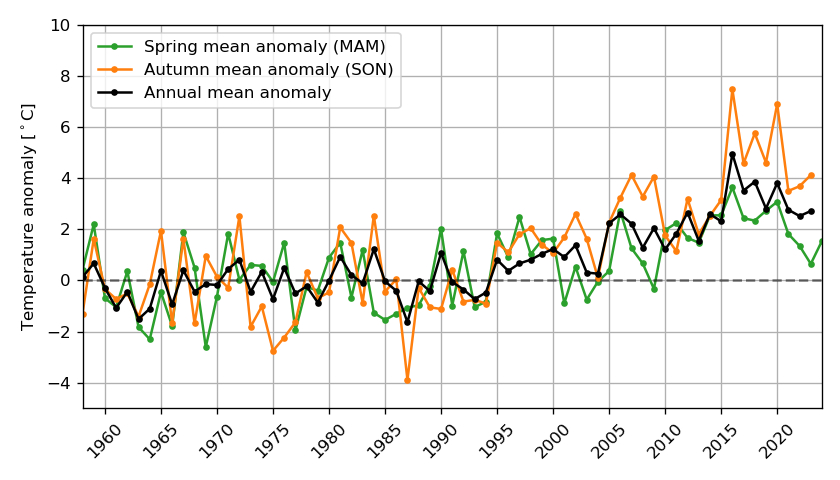
Anomaly of the +80N mean temperature index, compared with climate (annual mean
minus the corresponding climate value). All year anomaly is illustrated with the black
line, spring anomaly (March, April, May) is illustrated with th egreen line and Autumn
anomaly.
(September, October, November) in magenta. Reference climate is ECMWF-ERA40
1958-2002.
|
