Modelled Arctic sea ice
The graphics on right shows a map with modelled sea-ice thickness and curves with calculated total sea-ice volume for the Arctic
as a function of the day of the year. The mean volume and its standard deviation for the years 2004-2013 is shown with gray. The figures is based on calculations using the DMI operational coupled ocean- and sea-ice model
HYCOM-CICE. The total sea-ice volume is a product of the sea-ice concentration and its thichness.
Today, the sea-ice concentration (ice cover) is in general well estimated using satellite products, while the sea-ice thickness is
poor known.
The model gives a realistic estimate of the total amount of sea-ice within the Arctic. Whereby the robustness of the remaining
sea-ice can be assessed. This has eg. impact on whether the sea-ice along the East Greenland coast can survive all the way down
to the southern tip of Greenland, Cape Farewell. And perhaps even fill up the Julianehaab Bight causing inconvenience for the
maritime traffic.
The ice cover in the Arctic grows throughout the winter, before peaking in early spring. Melting picks up pace during the spring
as the sun gets stronger, and in September the extent of the ice cover is typically only around one third of its winter maximum.
On Polarportal
and on ocean.dmi.dk
one can follow the calculated daily sea-ice thickness and volume.
New graphics
We have improved the DMI operational ocean and sea-ice model HYCOM-CICE with
higher horizontal resolution and updated HYCOM and CICE code. In particular, the sea ice code has been greatly improved
with meltponds, sea-ice salinity, improved thermodynamics and much more. The freshwater discharge from Greenland
has also been greatly improved using freshwater product from
GEUS, which especially improves the coastal ocean currents
and thus the ice transport nearshore Greenland. The model has been running continuously since September 1990.
Therefore, we have by December 07, 2021 updated the graphics of sea-ice thickness and volume using the new and improved
data on Polarportal
and ocean.dmi.dk.
The improved model setup has led to higher variability as well as less adrupt melting during the melt season, which gives
a shift of approximately half a month for the time of minimum ice volume. The trend between the years is almost unchanged.
Thereby, a year with a large sea-ice volume in the old setup also has a large volume in the new setup, and similar for
years with low sea-ice volume.
Change in high performance computer
On 15. May 2024, there was a change in supercomputer (HPC) and associated update of the underlying code for the HYCOM and CICE models.
The setup is exactly the same and exactly the same data is assimilated. But any computer change can result in minor changes in model output over a long time of integration.
The graphics based on results from new HPC are marked as "Ver8.0r1".
|
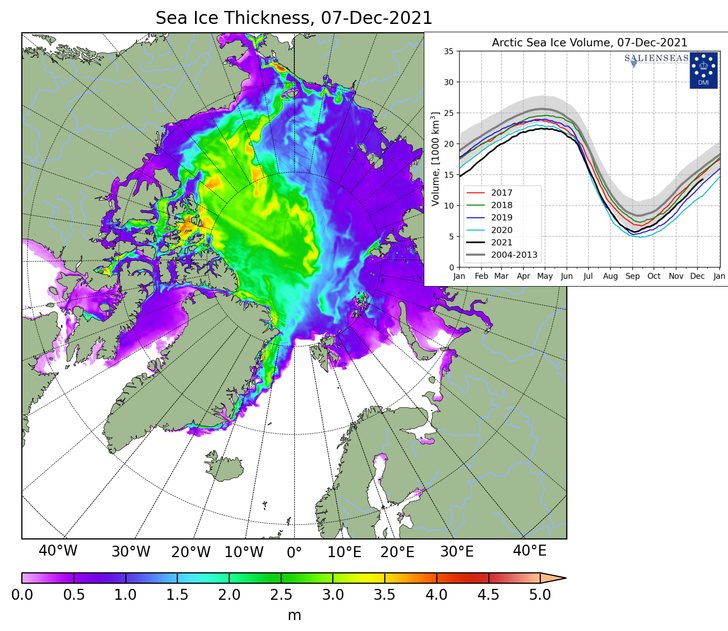 Modelled sea-ice thichness and volume.
The large map shows the sea-ice thickness, while the small figure shows the curves of sea-ice volume in recent years.
The gray area around the mean (2004-2013) corresponds to plus/minus 1 standard deviation.
Modelled sea-ice thichness and volume.
The large map shows the sea-ice thickness, while the small figure shows the curves of sea-ice volume in recent years.
The gray area around the mean (2004-2013) corresponds to plus/minus 1 standard deviation.
|
