|
|
This site has been updated with an extension of the input data record. Moreover, minor changes and improvements have been made: - The input data record has been extended from 2015 to 2021.
- Climatology for the latest WMO's climate periode (1991-2020) has been calculated and added to ease comparison with other climatological products.
- Plots and maps have been made bigger to show more details.
The previous version of the climatology is still available here.
|
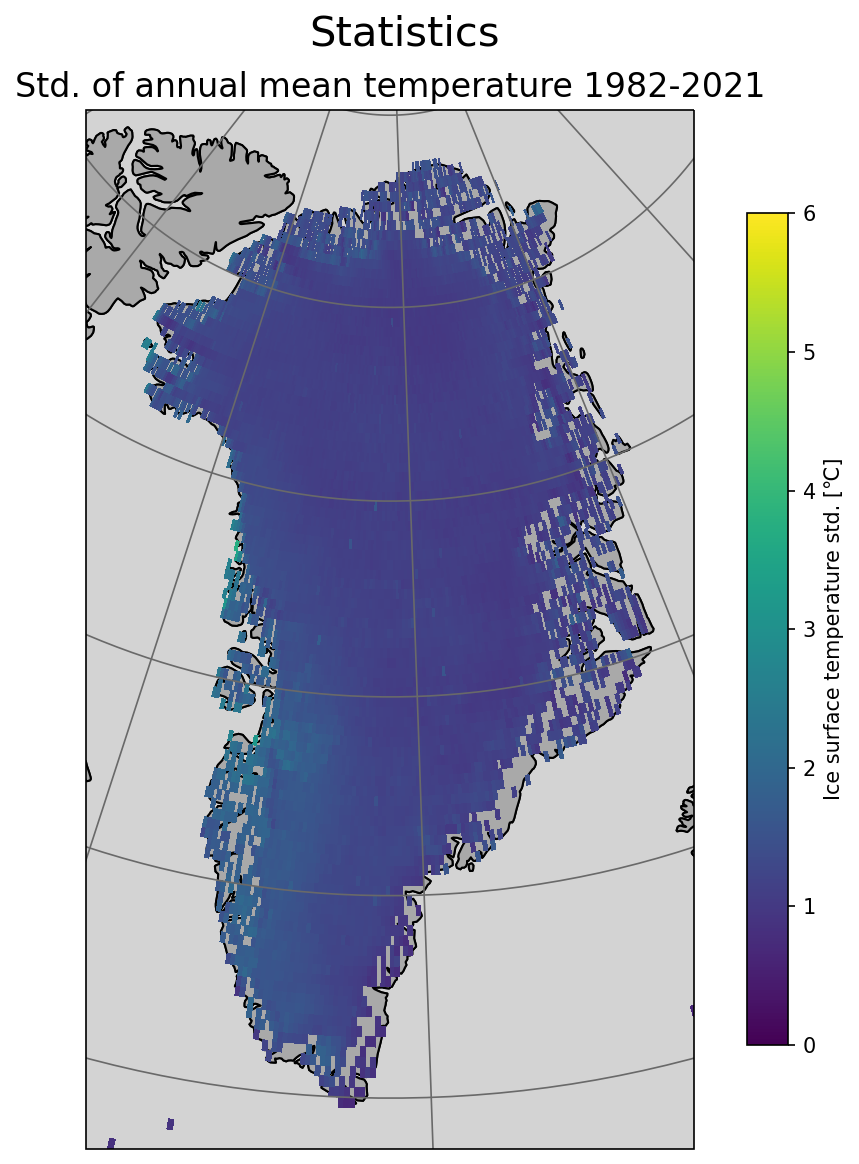
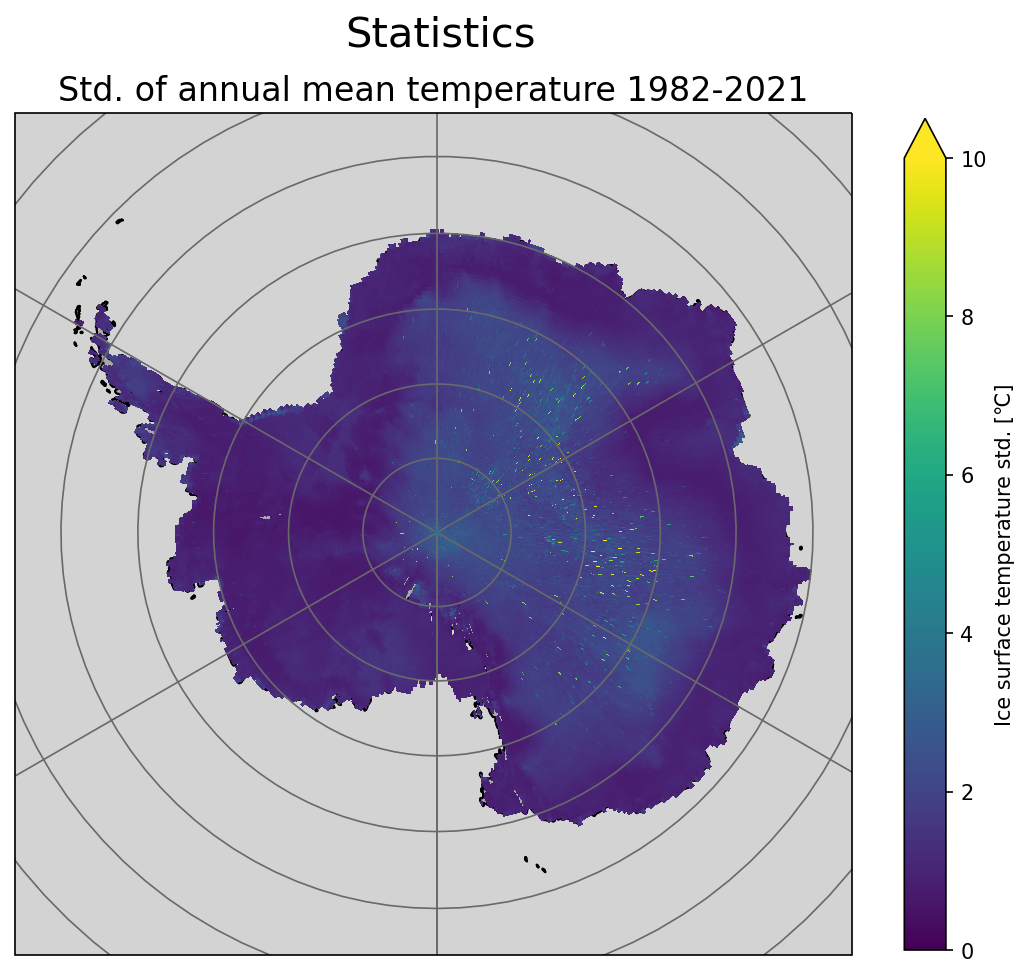
These maps show the standard deviation of monthly or yearly mean surface temperatures of Greenland and Antarctica in the full data set period, 1982-2021. An area surface is defined as sea ice if the monthly or yearly mean sea ice concentraion is greater than 15 %. The standard deviation is only plottet if the area has 10 or more years with a sea ice surface.
All plots are based on "Arctic and Antarctic ice Surface Temperature climate data set from thermal Infrared satellite data" data set (AASTI, version 2), produced by DMI and MET (see details here) and EUMETSAT OSISAF data sets OSI-450-a and OSI-430-a.
|
Arctic |
|
| | | Toggle period
wmo-standard / full |
| |
Annual |
Jan |
Feb |
Mar |
Apr |
May |
Jun |
Jul |
Aug |
Sep |
Oct |
Nov |
Dec |
| |
| |  |
 |
|
