|
The DMI wave model
The DMI wave model is WAM-Cycle4.5, developed by the SWAMP group [Komen et al.] in the late 1980'ies.
The DMI application focuses on Danish and nearby waters by successive nesting.
WAM calculates the spectral wave energy as a function of forecasted
wind speed and direction. This is in turn used to predict wave and swell height,
period and direction. The forecasts run 54 hours ahead, and are issued 4x daily.
Short description
Technical documentation (pdf, in danish)
Latest forecast (animation, java)
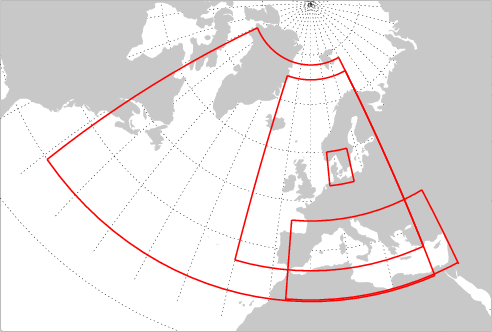
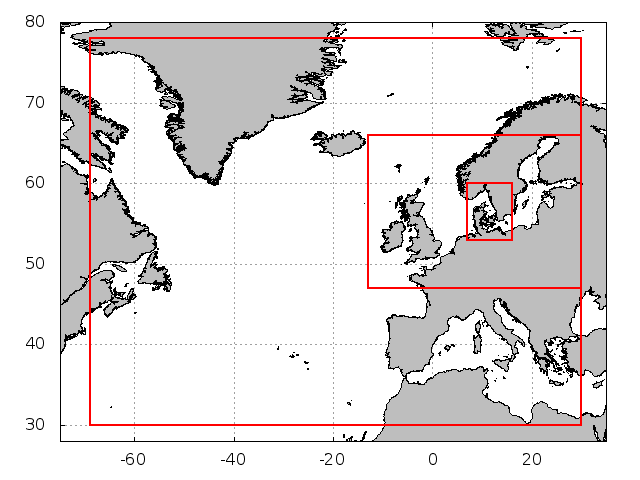
DMI-WAM model grids. left: until Nov 2016. right: since Dec 2016
Wave buoys
The buoy data is retrieved through the GTS, by download from ftp sites, or by personal contact.
The station list is not fixed. Active buoys are indicated by a red circle.
A buoy is inactive (blue) if no data was received OR
if the data has not yet been processed.
Station table
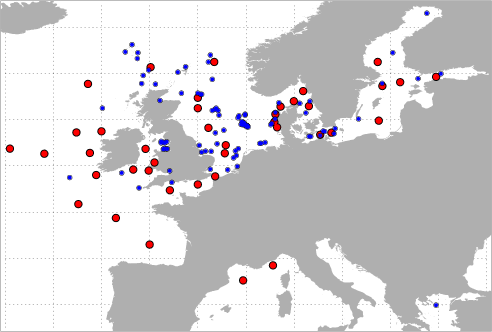
Buoy locations
Error measures
We calculate error measures for all stations with a reasonable data coverage.
Standard error - all waves
Hs mean error (bias), r.m.s. error (rms),
scatter index (si) and correlation coefficient (cc)
are calculated as functions of location and forecast range. Range averaging
produces one value of each error measure per station. Conversely, station averaging
gives the error dependency on forecast range.
Peak error - highest waves only
The peak error (pe) is the difference between the highest predicted
and the highest observed wave height at a given location during a storm.
Actual and predicted time of the maximum may differ by a few hours.
The pe is calculated for the 5 severest storms at each station.
False alarms are not considered.
Averaging gives the peak bias (pb), and peak % bias (pb%)
for that station,
for each 6 hour forecast range block (1-6, 7-12, .. hours ahead).
Range block averages reduces the peak error measures to one absolute value (in meters)
and one relative value (in percent) per station.
Conversely, station averaging gives the error dependency on forecast range block.
Key numbers - station averages
Double averaging - first over ranges (for peaks: range blocks), then over stations - results
in one single value for each error measure. All stations and ranges are given equal weight.
....................
Jacob Woge Nielsen - August 8th 2007
|
