Storm surge forecast Q-uality
We compare one year of observed and predicted high waters.
This may be a calendar year, or the past 12 months.
A total of 18 fixed Danish coastal stations are used, as indicated on the map below.
![[map of stations]](stations.png)
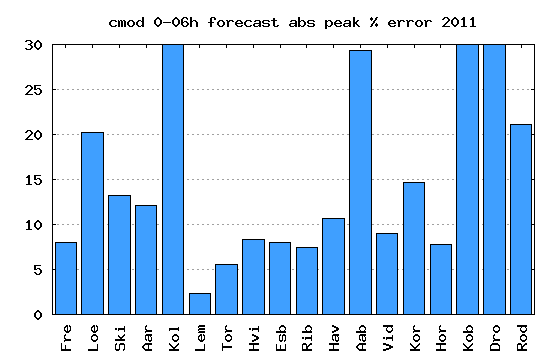
Q is the absolute peak error in percent,
averaged for the top 3 high waters at each station.
Calculation method:
HW = High Water, HW1=highest, HW2=second highest, HW3=third highest
Relative Absolute Peak Error PE = 100 * | HW_obs - HW_pred | / HW_obs [%]
Mean for a station MPE = (PE1+PE2+PE3) / 3
Mean for all stations Q = (MPE_st1+...+MPE_stN) / N [N=number of stations]
Q is calculated for forecast ranges 0-6, 6-12, ... 54-60 hours (for models run
on a 6 hour schedule), or ranges 0-12, 12-24, ... 48-60 hours (for models run
on a 12 hour schedule.
In Ministry reports, we use the one day forecast (18-24 or 12-24 hours).
For model intercomparison, we use the shortest forecast (0-6 or 0-12 hours).
North Sea - Baltic models
- BSHcmod Operational 3-dimensional hydrodynamical model.
Storm surge model since ultimo 2007 (for Limfjorden, since medio 2008).
- DKSS2010. New version of BSHcmod. Operationalised medio 2011.
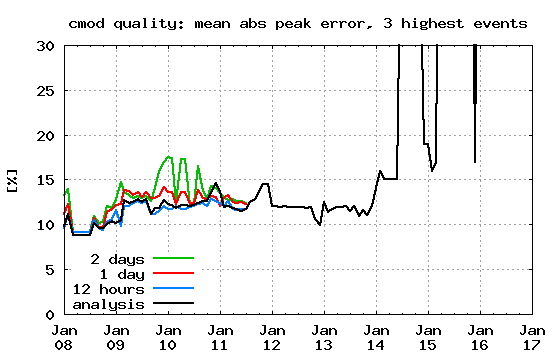
Monthly results
12-month running mean of Q, valid for the model that is operational at any given time.
![[cmod 12-month running mean of Q]](plots/running_opr.png)
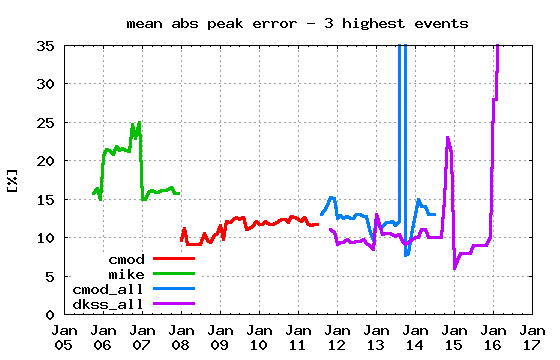
Several years
Several models
Single stations
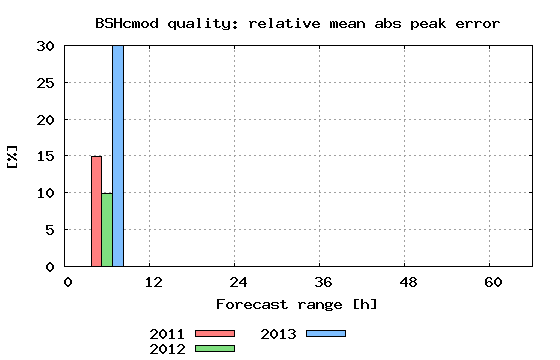
- BSHcmod, 2011
- BSHcmod, several years: click on the map to pick a station
