|
|
JavaScript - Changing images back and forth
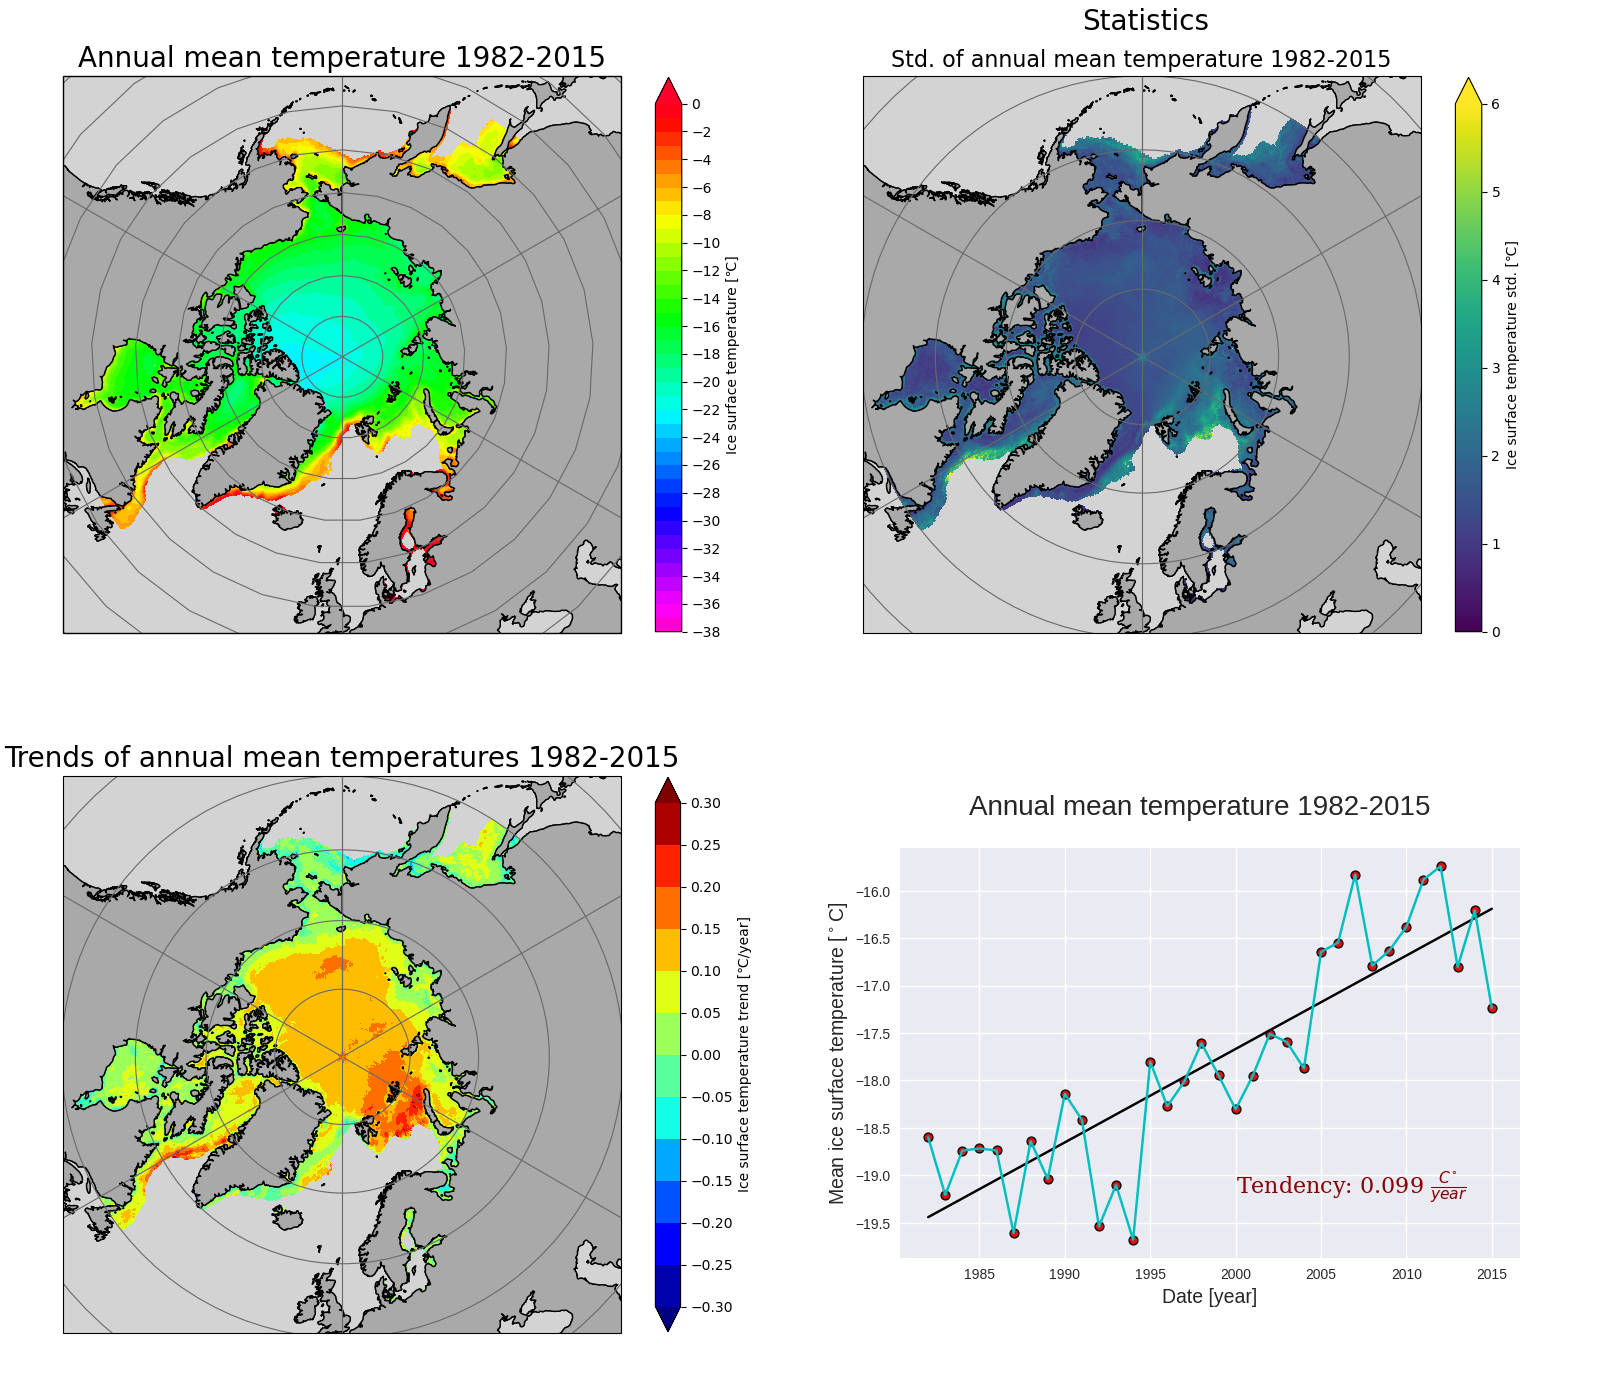
IntroductionThis site shows ice surface temperature (IST) climatology for sea ice in areas north of 50 N and south of 50 S for the period 1982 - 2015. All plots are based on "Arctic and Antarctic ice Surface Temperature climate data set from thermal Infrared satellite data" data set (AASTI, version 2), produced by DMI and MET (see details here). In order to analyze the development of temperature over time, linear regression analyses has been made in every spatial point. Trends, p-values and correlation coefficients are results from these analyses. Click on the picture to change between the different statistical parameters and choose between climatology for the whole year ("Year") or a specified month (e.g. "Jan").
|
Arctic |
|
| | | Year |
| |
Jan |
Feb |
Mar |
Apr |
May |
Jun |
Jul |
Aug |
Sep |
Oct |
Nov |
Dec |
| |
| |
 |
Antarctic |
|
| | | Year |
| |
Jan |
Feb |
Mar |
Apr |
May |
Jun |
Jul |
Aug |
Sep |
Oct |
Nov |
Dec |
| |
| | 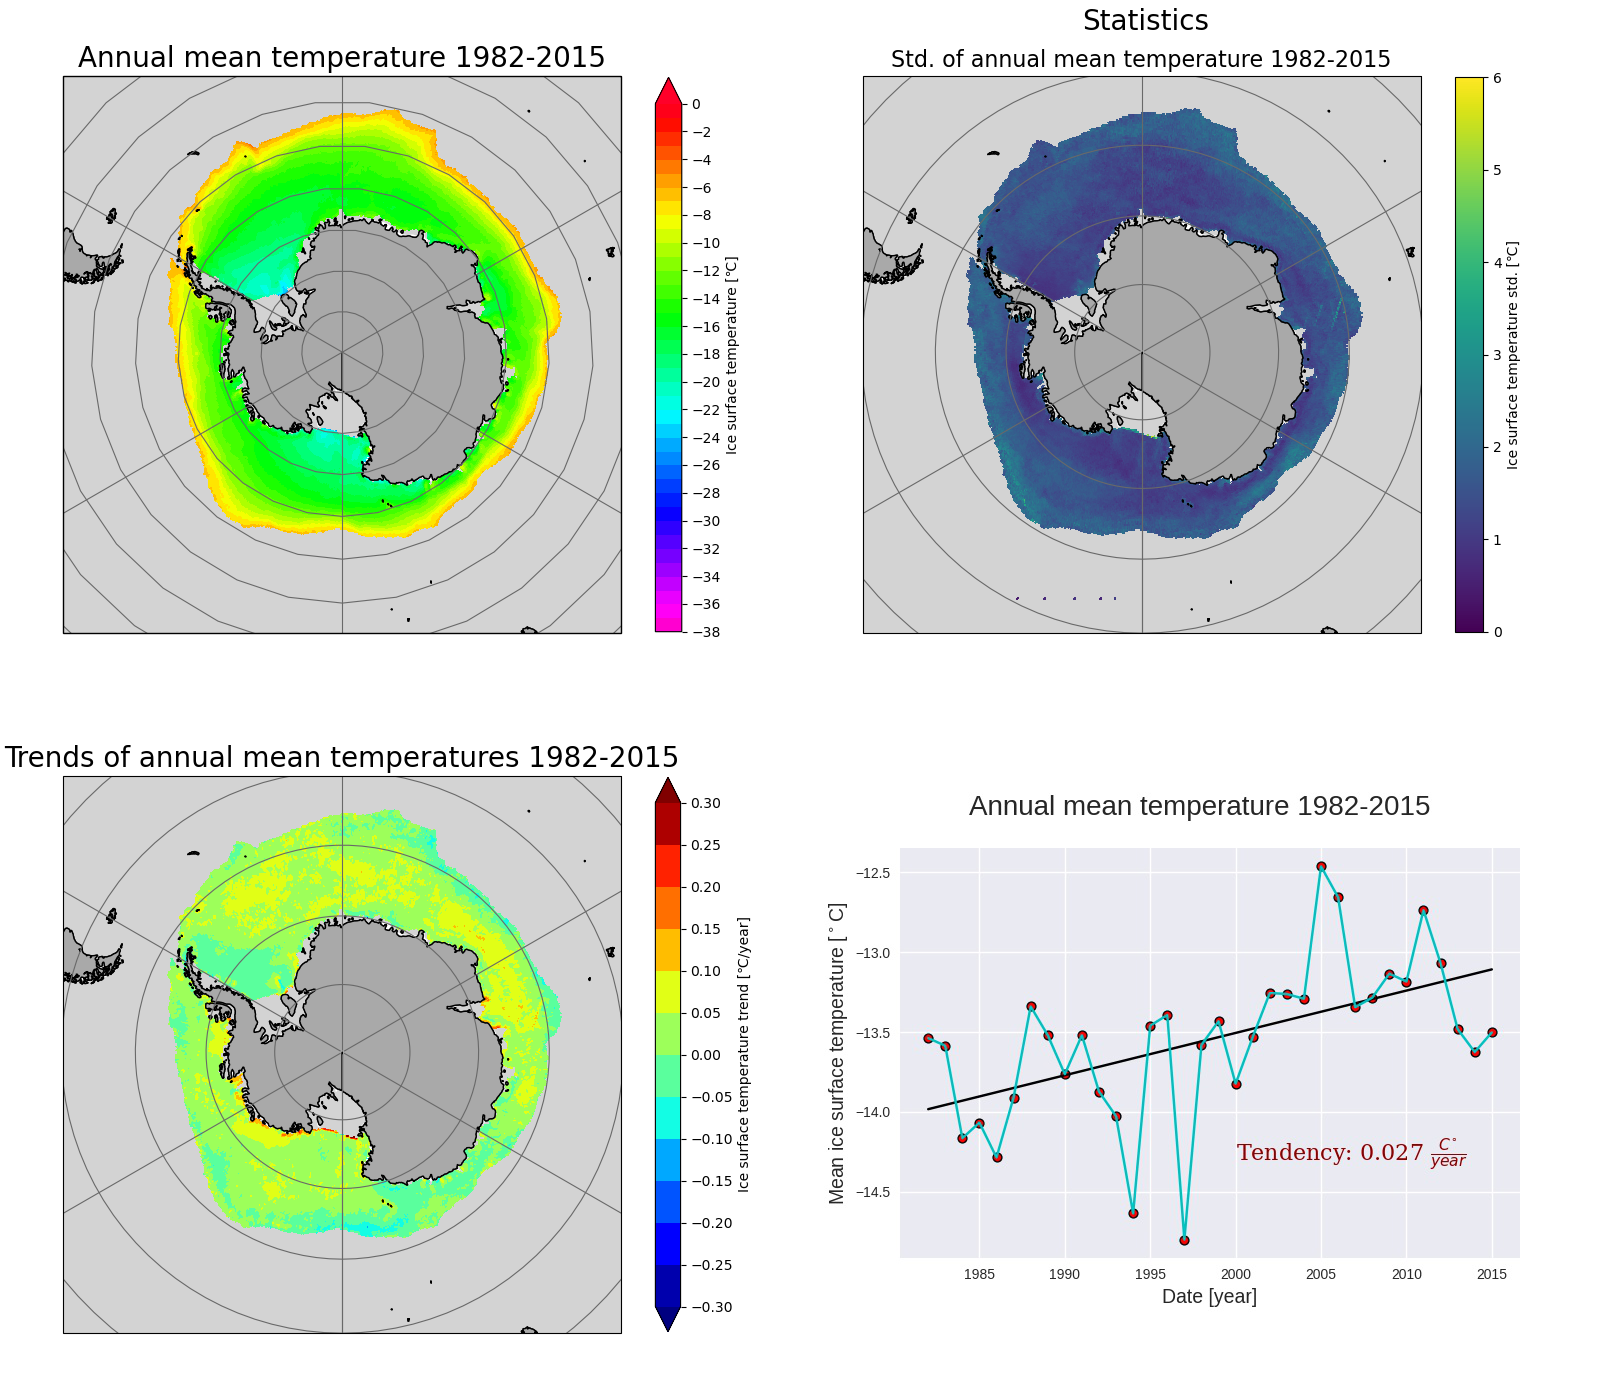 |
Plot descriptions Mean temperature maps (upper left corner). These maps display the mean of the annual or monthly mean ice surface temperature across the full period. Standard deviation (upper right corner). These maps display the standard deviation of the annual or monthly mean IST across the full period. p-value of trend significance test (upper right corner). These maps display the resulting p-values from the linear regression analysis with the null hypothesis that the slope/trend is equal to zero. Correlation coefficient (upper right corner). These maps display the Pearson product-moment correlation coefficient, which is a result from the linear regression analysis. Trends (lower left corner). These maps display the trends from the linear regression analysis. Mean temperature graphs (lower right corner). These graphs show the spatial mean of the monthly or annual mean ice surface temperature versus time. A linear fit is also seen plotted with its the slope shown as "Tendency". UncertaintiesAll data and plots on this site are affected by uncertainties, which we are in the process of quantifying. Thus, DMI can not yet guaranty for the precision of the data shown. DMI preserves the right to update this site, if we find errors in the data. A scientific paper on the AASTI data set is being prepared, and the precision of the AASTI data set will only be published, when the paper has been approved. |
