Ice climatology of the Arctic and Antarctic
Surface temperature
Dansk version
The Arctic Today
Climate and Weather
- Mean temperatures
  North of 80N

- Ice Extent in the
  Northern Hemisphere

- Minimum Ice Extent
  since 1979

- Monthly mean Sea Ice
  Extent since 1979

Satellite Products
- Sea ice drift and-
  sea ice concentration

- Sea Surface temp. and
  anomalies

- Ice temperatures
Climatological Sea Ice Atlas
Ice concentration
Monthly means
Monthly variations
Ice extent
Monthly
Download ice edges
Break-up, freeze-up and open water days
Mean
Variation
Trend (significance)
Surface temperature,
sea ice

Middel
Variation
Trend
Surface temperature,
ice caps

Middel
Variation
Trend
Sea ice temperature and extent
Hysteresis
Model Products
- Ice thickness and volume
- Ice and Ocean Forecasts
Seaice & Navigation
- Satellite Images
  around Greenland

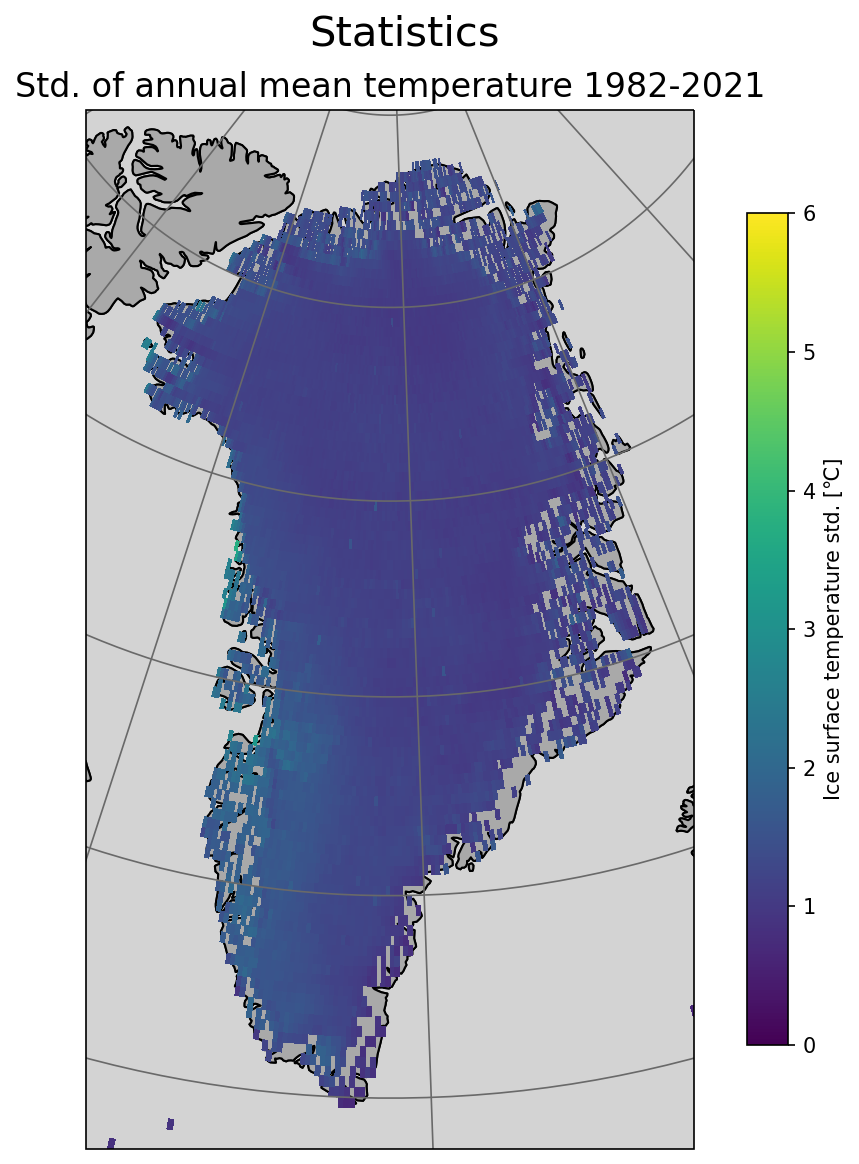
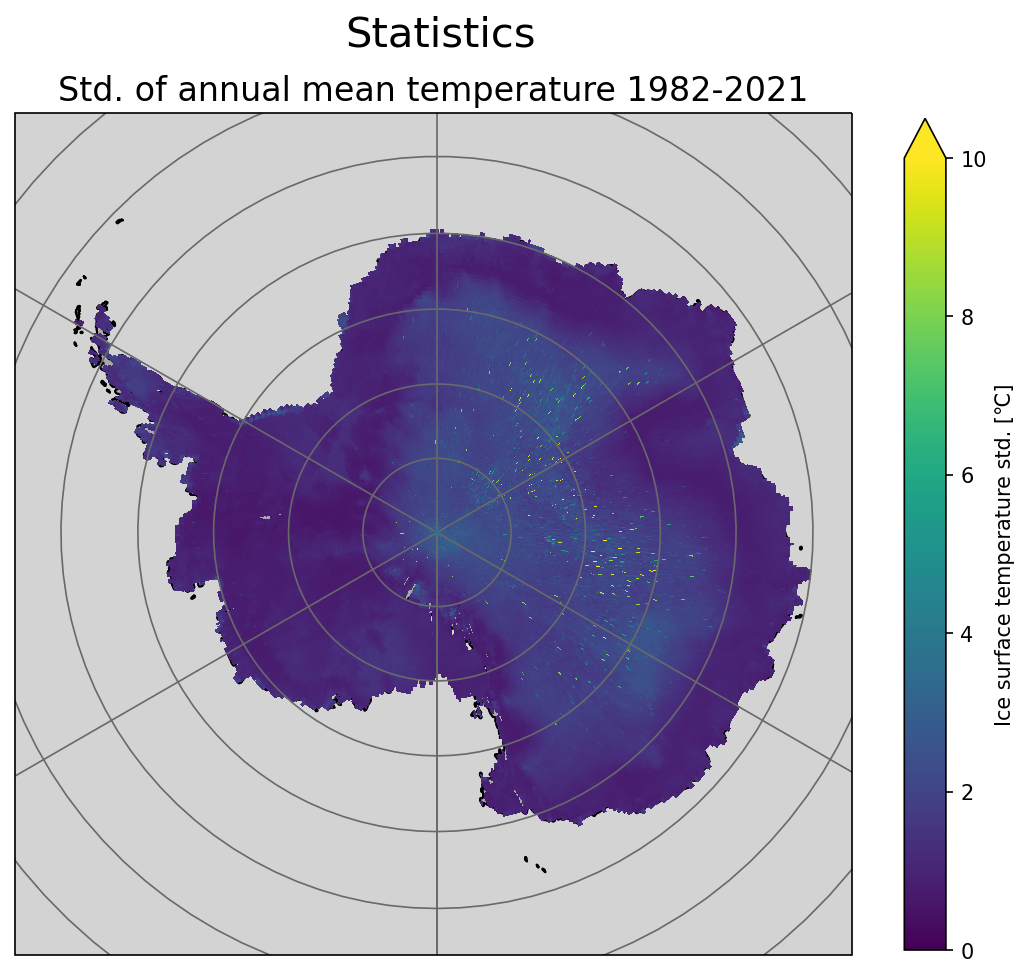
These maps show the standard deviation of monthly or yearly mean surface temperatures of Greenland and Antarctica in the full data set period, 1982-2021. An area surface is defined as sea ice if the monthly or yearly mean sea ice concentraion is greater than 15 %. The standard deviation is only plottet if the area has 10 or more years with a sea ice surface.

All plots are based on "Arctic and Antarctic ice Surface Temperature climate data set from thermal Infrared satellite data" data set (AASTI, version 2), produced by DMI and MET (see details here) and EUMETSAT OSISAF data sets OSI-450-a and OSI-430-a.


Toggle period
wmo-standard / full
|
Annual Jan Feb Mar Apr May Jun Jul Aug Sep Oct Nov Dec

Arctic

Antarctic